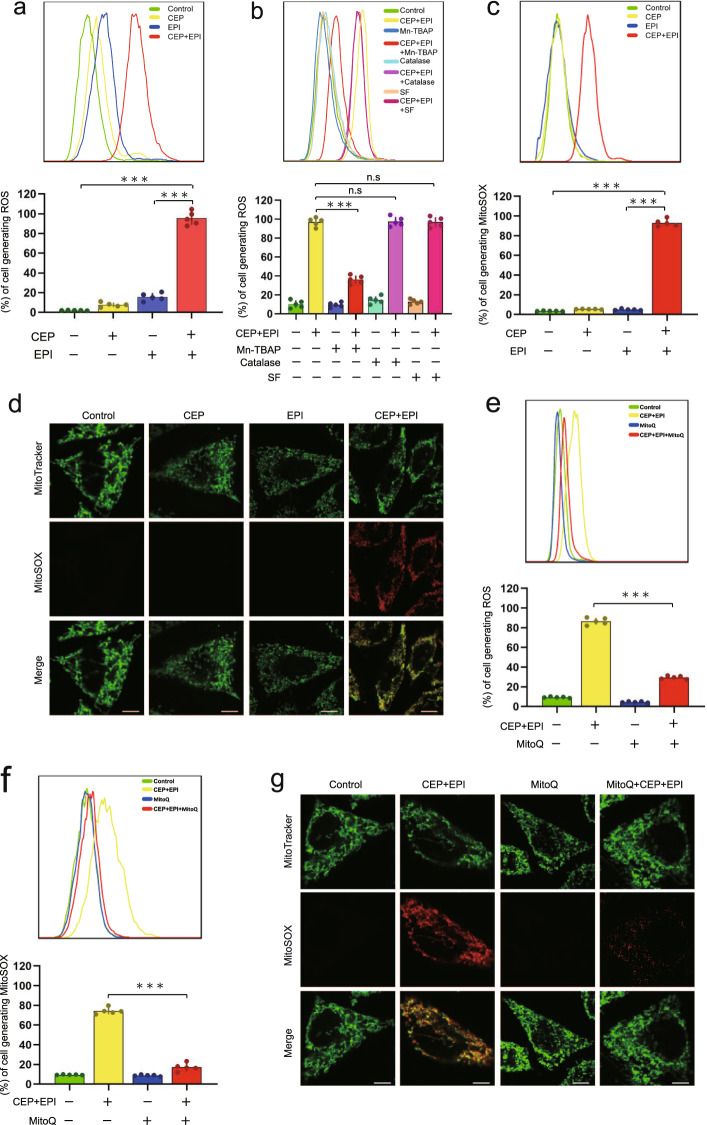
Fig. 7. Combination of cepharanthine/epirubicin induces mitochondrial oxidative stress.
a MDA-MB-231 cells were treated without or with cepharanthine or epirubicin alone or combination of cepharanthine/epirubicin for 48 h, after which ROS production was determined by DCFHDA staining and flow cytometry. b Cells were pretreated with antioxidants including as TBAP (200 μM), catalase (5000 U/mL), and sodium formate (SF, 2 mM) for 1 h, followed by treatment with combination of cepharanthine/epirubicin for 48 h, ROS production was determined by DCFHDA staining and flow cytometry. c, d Cells were treated in (a), mitochondrial superoxide production was determined by the fluorescent probes MitoSOX™ staining and flow cytometry. Scale bars, 10 μm. e, f Cells were pretreated with MitoQ (a mitochondrial targeted antioxidant), followed by treatment with combination of cepharanthine/epirubicin for 48 h, ROS and MitoSOX production was determined by DCFHDA or MitoSOX™ staining and flow cytometry. g The fluorescence intensity of mitochondrial superoxide as measured by MitoSOX and MitoTracker in cells treated without or with MitoQ or combination of cepharanthine/epirubicin. Scale bars, 10 μm. Data represented as mean ± SD (n = 5, ***P < 0.001, ns not significant, Student’s two-tailed unpaired t-tests).

