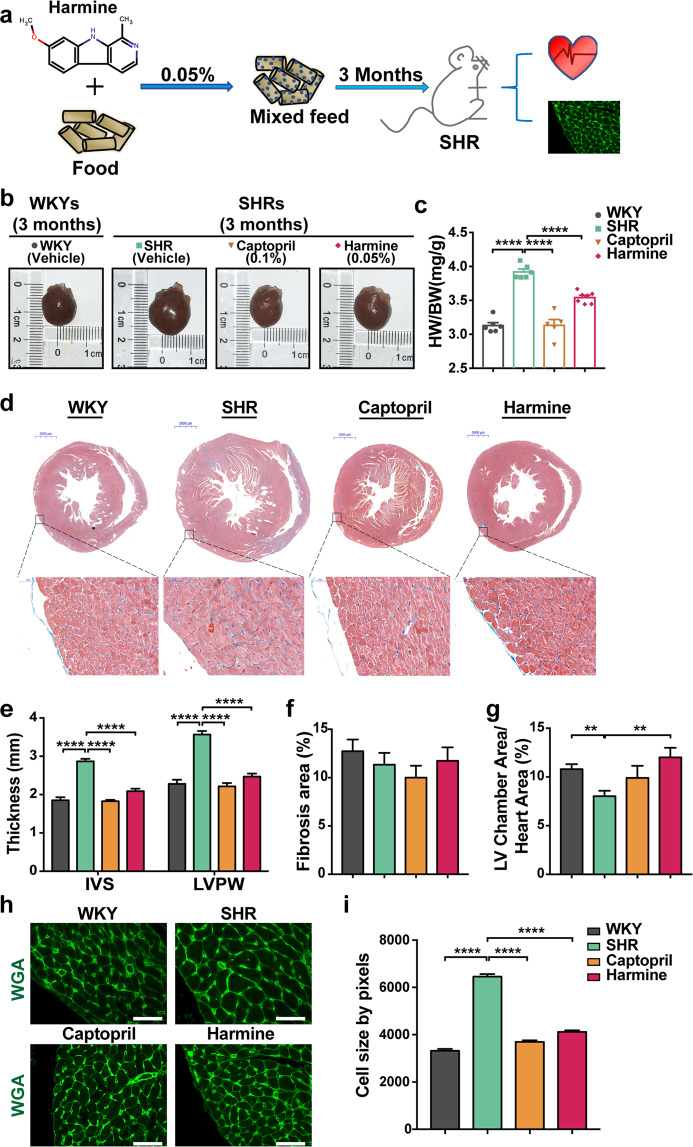
Fig. 1. Harmine alleviates pressure overload-induced cardiac hypertrophy in SHRs.
a Schematic overview of harmine treatments. SHRs at 6 weeks of ages were given the mixed feed with 0.05% harmine or 0.1% captopril for additional 3 months. WKYs and SHRs group as blank control contained no pharmaceutical additives (WKYs, n = 6; SHRs, n = 6; Captopril as positive control, n = 5; Harmine, n = 7). b Macroscopic view of heart size. Scale bar: 2000 μm. c Quantification of heart weight over body weight ratio in each group. d Representative Masson’s trichrome staining images of heart tissues (upper scale bars: 2 mm), and high-magnification views of LV wall (bottom, scale bars: 50 μm). e Statistics of the average thickness of IVS and LVPW in each group. f Quantification the ratio of myocardial fibrosis area. g The ratios of LV chamber area to whole heart area. h Heart tissue slices from each group were stained with wheat germ agglutinin (WGA). Scale bars, 50 μm. i Quantification of CMs cross-sectional area with WGA staining images (n > 400). Data are mean ± SEM. **P < 0.01, ****P < 0.0001 (two-tailed Student’s t test).

