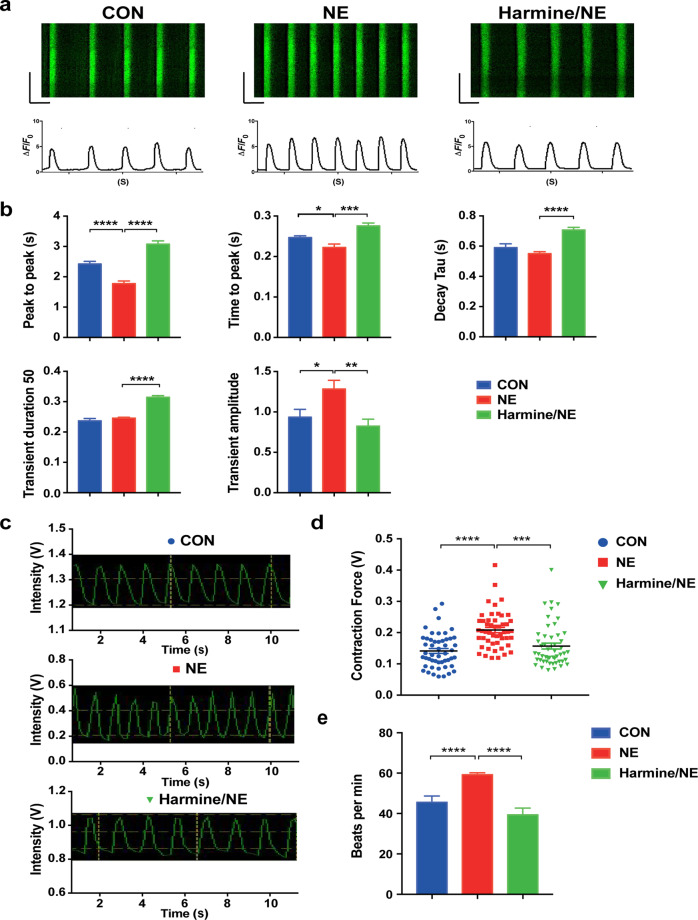
Fig. 5. The contractility and calcium imaging analyses of hESC-derived cardiomyocytes after treatment of harmine.
a Representative calcium transients recorded in single cardiomyocyte after harmine treatment (25 μM; NE 20 μM). b Quantification of calcium handling parameters (peak to peak, time to peak, decay time, transient duration 50, transient amplitude (ΔF/F0)) for each group. n > 20 cells recorded for each group in every experiment. c Representative traces of contraction movements from single cardiomyocyte recorded by FelixGX detection system. d Quantification of relative contractility in single cardiomyocyte 24 h after harmine (25 μM) or/and NE (20 μM) treatment. n > 50 cells recorded for each group. e Quantification of beating frequency followed harmine and NE treatment (n > 18 for each group). Data are mean ± SEM of three independent experiments. *P < 0.05, **P < 0.01, ***P < 0.001, ****P < 0.0001 by two-tailed Student’s t test.

