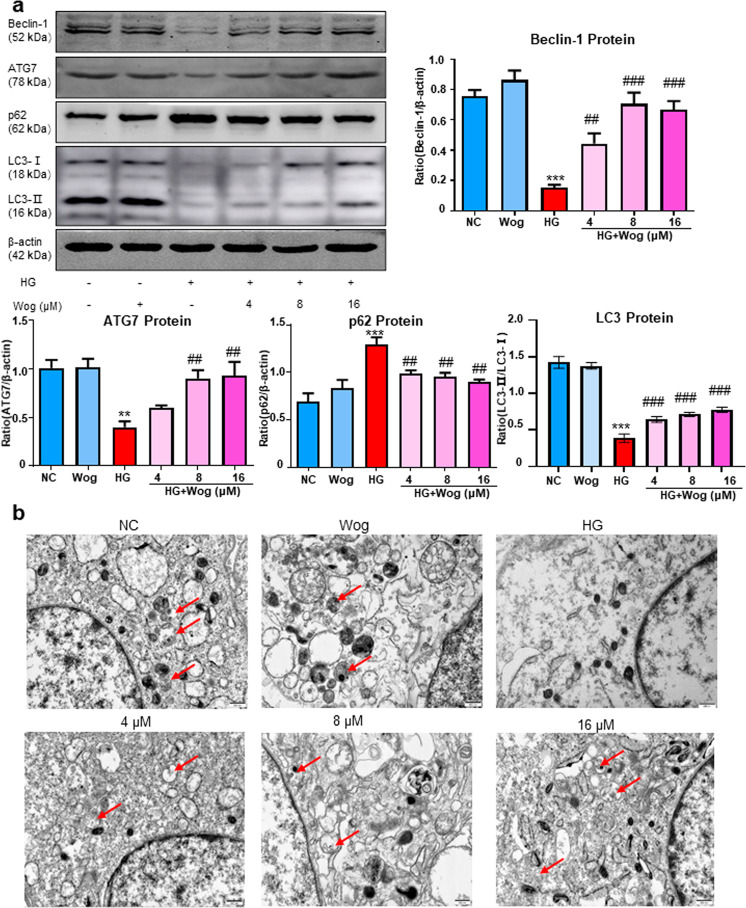
Fig. 2. Wogonin promotes HG-induced autophagy disorders.
b Western blot analysis of beclin-1, ATG7, LC3, and p62 in MPC5 cells. b Representative transmission electron microscopy images of autophagosomes in MPC5 cells, the arrows indicate autophagosomes. Scale bar = 500 nm. Results represent mean ± SEM of three independent experiments. **P < 0.01, ***P < 0.001 vs NC. ##P < 0.01, ###P < 0.001 vs HG. HG high glucose, NC normal control, Wog wogonin

