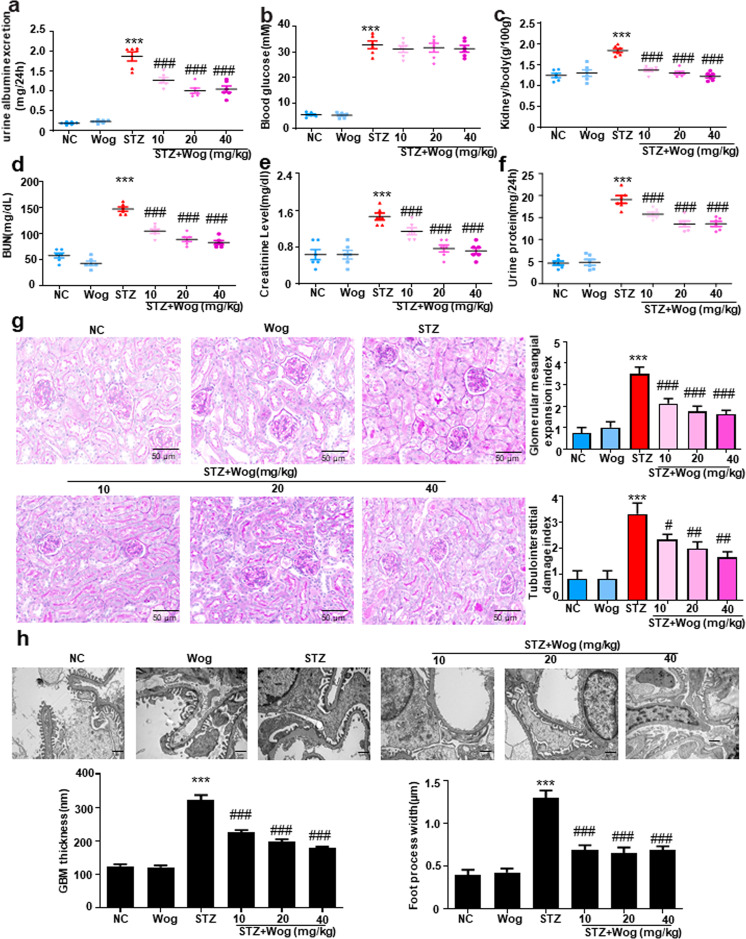
Fig. 7. Physical and biochemical markers and histopathology of type 1 diabetic mice.
a Analysis of urine albumin excretion. b Fasting blood glucose in different groups. c Kidney/body weight. d serum BUN assay. e serum Cr assay. f Twenty-four hours urinary protein quantitation. g Histological observations of kidney sections stained with periodic acid–Schiff (PAS) from different groups treated with or without wogonin. Scale bar = 50 μm. h Representative transmission electron microscopy images of podocyte foot processes and glomerular basement membrane. Scale bar = 1 μm. Results represent mean ± SEM for 6–8 mice. ***P < 0.001 vs NC. #P < 0.05, ##P < 0.01, ###P < 0.001 vs STZ. NC normal control, Wog wogonin, STZ streptozotocin

