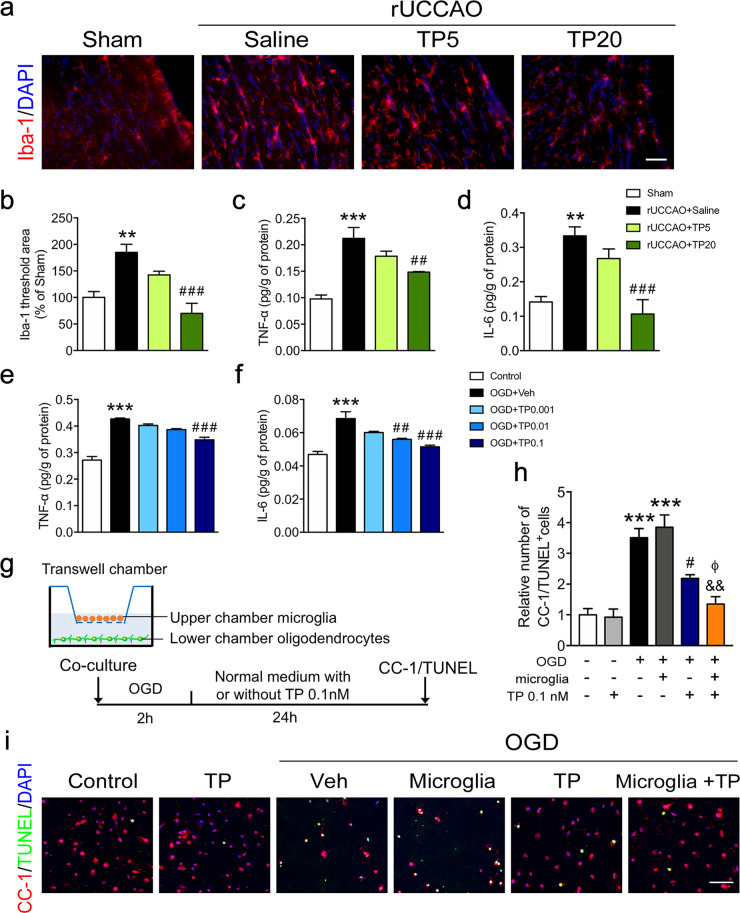
Fig. 5. Triptolide suppressed microglial activation and the expression of proinflammatory cytokines after chronic cerebral hypoperfusion or OGD.
a, b Immunohistochemical visualization, morphological characterization, and quantification of Iba-1+ microglia at 7 d after rUCCAO in mice administered with triptolide at dosage of 5 μg·kg−1·d−1 (TP5) or 20 μg·kg−1·d−1 (TP20). c, d ELISA of TNF-α and IL-6 levels in the corpus callosum at 7 d after rUCCAO in mice administered with TP5 or TP20. e, f ELISA of TNF-α and IL-6 levels in BV2 cells subjected to OGD for 2 h and administered with triptolide (0.001, 0.01, and 0.1 nM) for 1 h during reperfusion. g Schematic diagram of coculture experiments using a Transwell system. Primary cultured oligodendrocytes and microglia were isolated by the shake-off method from mixed cortical glial cell cultures. Microglia were cocultured with mature oligodendrocytes in a Transwell system and subsequently subjected to OGD for 2 h and treated with or without triptolide (0.1 nM) for 24 h during reperfusion. h, i Immunohistochemical visualization and quantification of the numbers of CC-1 and TUNEL double-positive mature apoptotic oligodendrocytes after OGD/reperfusion. Scale bars, 50 μm. n = 4–5 from at least three independent experiments. **P < 0.01, ***P < 0.001 vs. the sham group or the control group; #P < 0.05, ##P < 0.01, ###P < 0.001 vs. the rUCCAO + saline group or the OGD + Veh group; &&P < 0.01 vs. the OGD + microglia group; ΦP < 0.05 vs. the OGD + TP 0.1 group.

