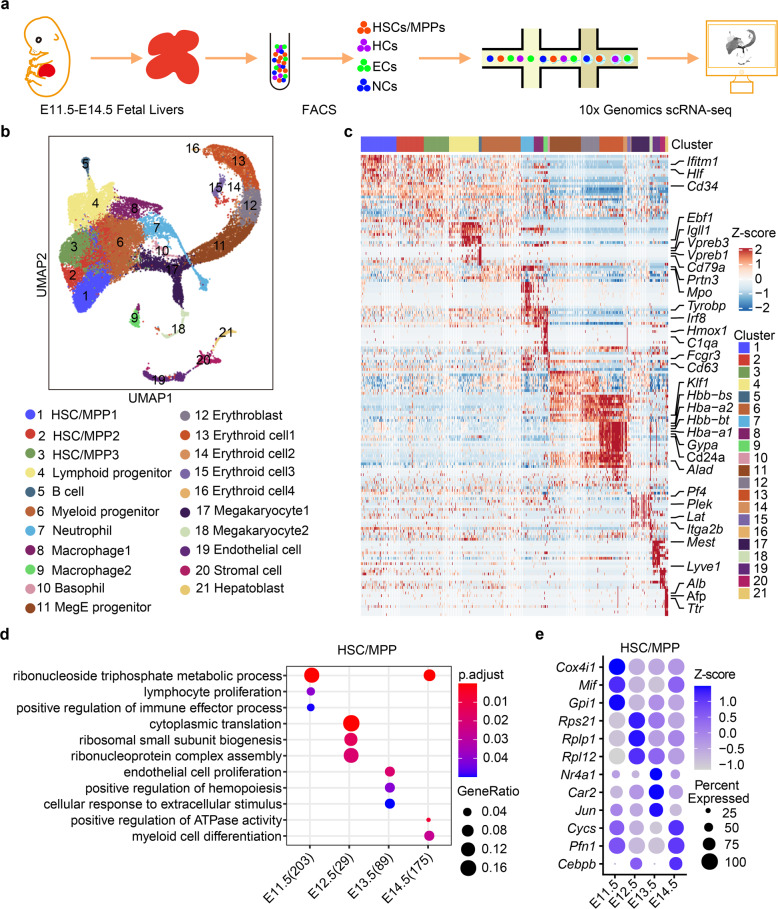
Fig. 1. Single-cell transcriptomic atlas of the developing mouse FL.
a Schematic diagram of the procedures for tissue processing, cell isolation, and scRNA-seq profiling of FL. HSCs/MPPs, hematopoietic stem cells and multipotent progenitors; ECs, endothelial cells; HCs, hematopoietic cells; NCs, non-hematopoietic/non-endothelial cells. b UMAP visualization of all single cells colored by cell clusters in the FL. MegE progenitor, megakaryocytic-erythroid progenitor. c Heatmap showing row-scaled expression of the top 20 DEGs (Bonferroni-corrected P < 0.05, Wilcoxon Rank Sum test) per cluster. d Enriched GO terms in HSCs/MPPs during FL development. e Dot plots of the enriched DEGs in HSCs/MPPs during FL development.

