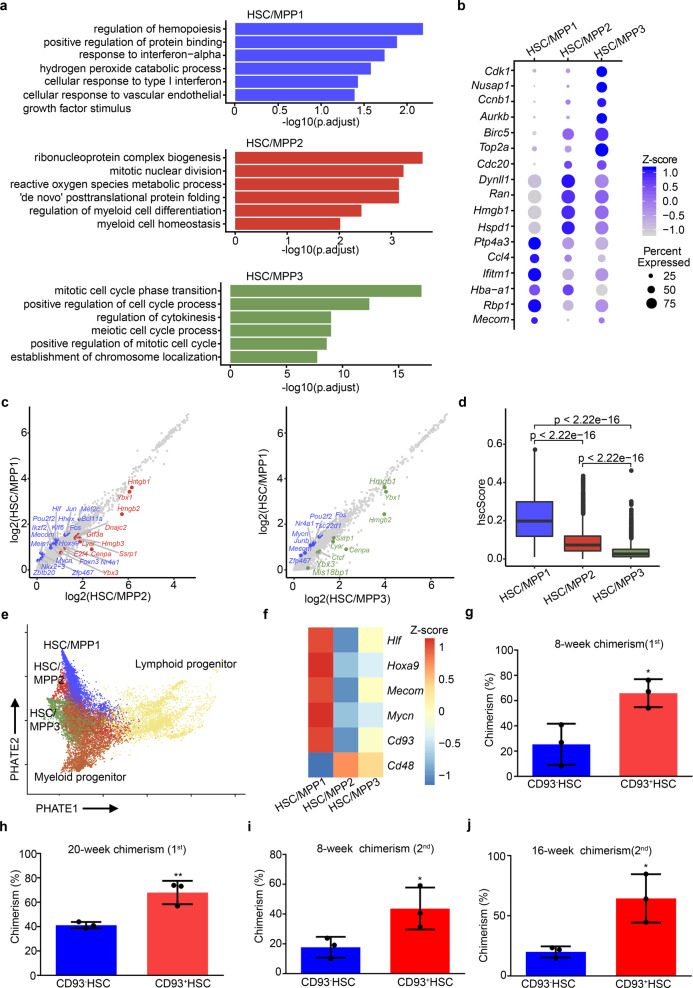
Fig. 2. CD93-enriched HSCs/MPPs exhibit enhanced stem cell properties.
a GO analysis among the three HSC/MPP subtypes. b Dot plots of the enriched DEGs in the three HSC/MPP subtypes. c Scatter plots of all gene expressions in HSC/MPP1 versus HSC/MPP2 (left) or versus HSC/MPP3 (right). Differentially expressed transcription factors are colored. d Boxplots showing the hscScore distribution in the three HSC/MPP subtypes. Student’s t-test. e Trajectory analysis by PHATE reconstructing the lineage differentiation from HSCs/MPPs to lymphoid and myeloid progenitors, respectively. f Heatmap showing the expression pattern of HSC/MPP signature genes and Cd93 in the three HSC/MPP subtypes. g Donor-derived chimerism in the peripheral blood (PB) of recipients at 8 weeks after primary transplantation using CD93+SLAM-LSK (CD93+ HSC) and CD93– HSC. n = 3 biological replicates. h Donor-derived chimerism in the PB of recipients at 20 weeks after primary transplantation using CD93+ HSC and CD93– HSC. n = 3 biological replicates. i Donor-derived chimerism in the PB of recipients at 8 weeks after secondary transplantation using CD93+ HSC and CD93– HSC. n = 3 biological replicates. j Donor-derived chimerism in the PB of recipients at 16 weeks after secondary transplantation using CD93+ HSC and CD93– HSC. n = 3 biological replicates. The statistical results are presented as means ± SEM. Student’s t-test; *P < 0.05; **P < 0.01.

