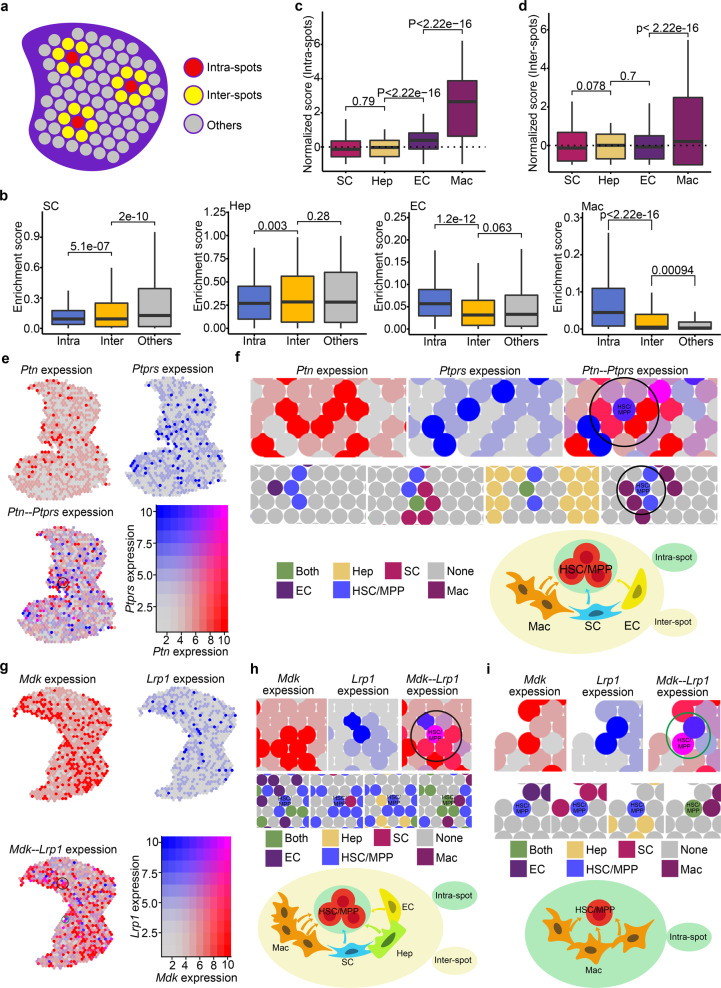
Fig. 4. Identification of expansion units of HSCs/MPPs.
a Schematic diagram indicating the intra-spots, inter-spots and others. Intra-spots, HSC/MPP-localized spots; Inter-spots, HSC/MPP-surrounded spots; Others, other distant spots. b Boxplots showing the enrichment score of niche cells in intra-spots, inter-spots, and others. c Boxplots showing the normalized (enrichment) score of niche cells in intra-spots. d Boxplots showing the normalized (enrichment) score of niche cells in inter-spots. e Co-expression pattern of Ptn and Ptprs in the FL section. f Spatial feature plots of Ptn−Ptprs-enriched HSC/MPP expansion units. Spatial feature plots showing the expression pattern of ligand gene Ptn in niche cells-localized spots (top, red spots), and receptor gene Ptprs in HSCs/MPPs-localized spots (top, blue spots). Spatial feature plots showing the cell types in HSC/MPP expansion units (middle). Schematic diagram indicating the Ptn−Ptprs-enriched HSC/MPP expansion units (bottom). g Co-expression pattern of Mdk and Lrp1 in the FL section. h Spatial feature plots of the Mdk−Lrp1-enriched HSC/MPP expansion units (inter-spots). i Spatial feature plots of the Mdk−Lrp1-enriched HSC/MPP expansion units (intra-spots).

