Fig. 4.

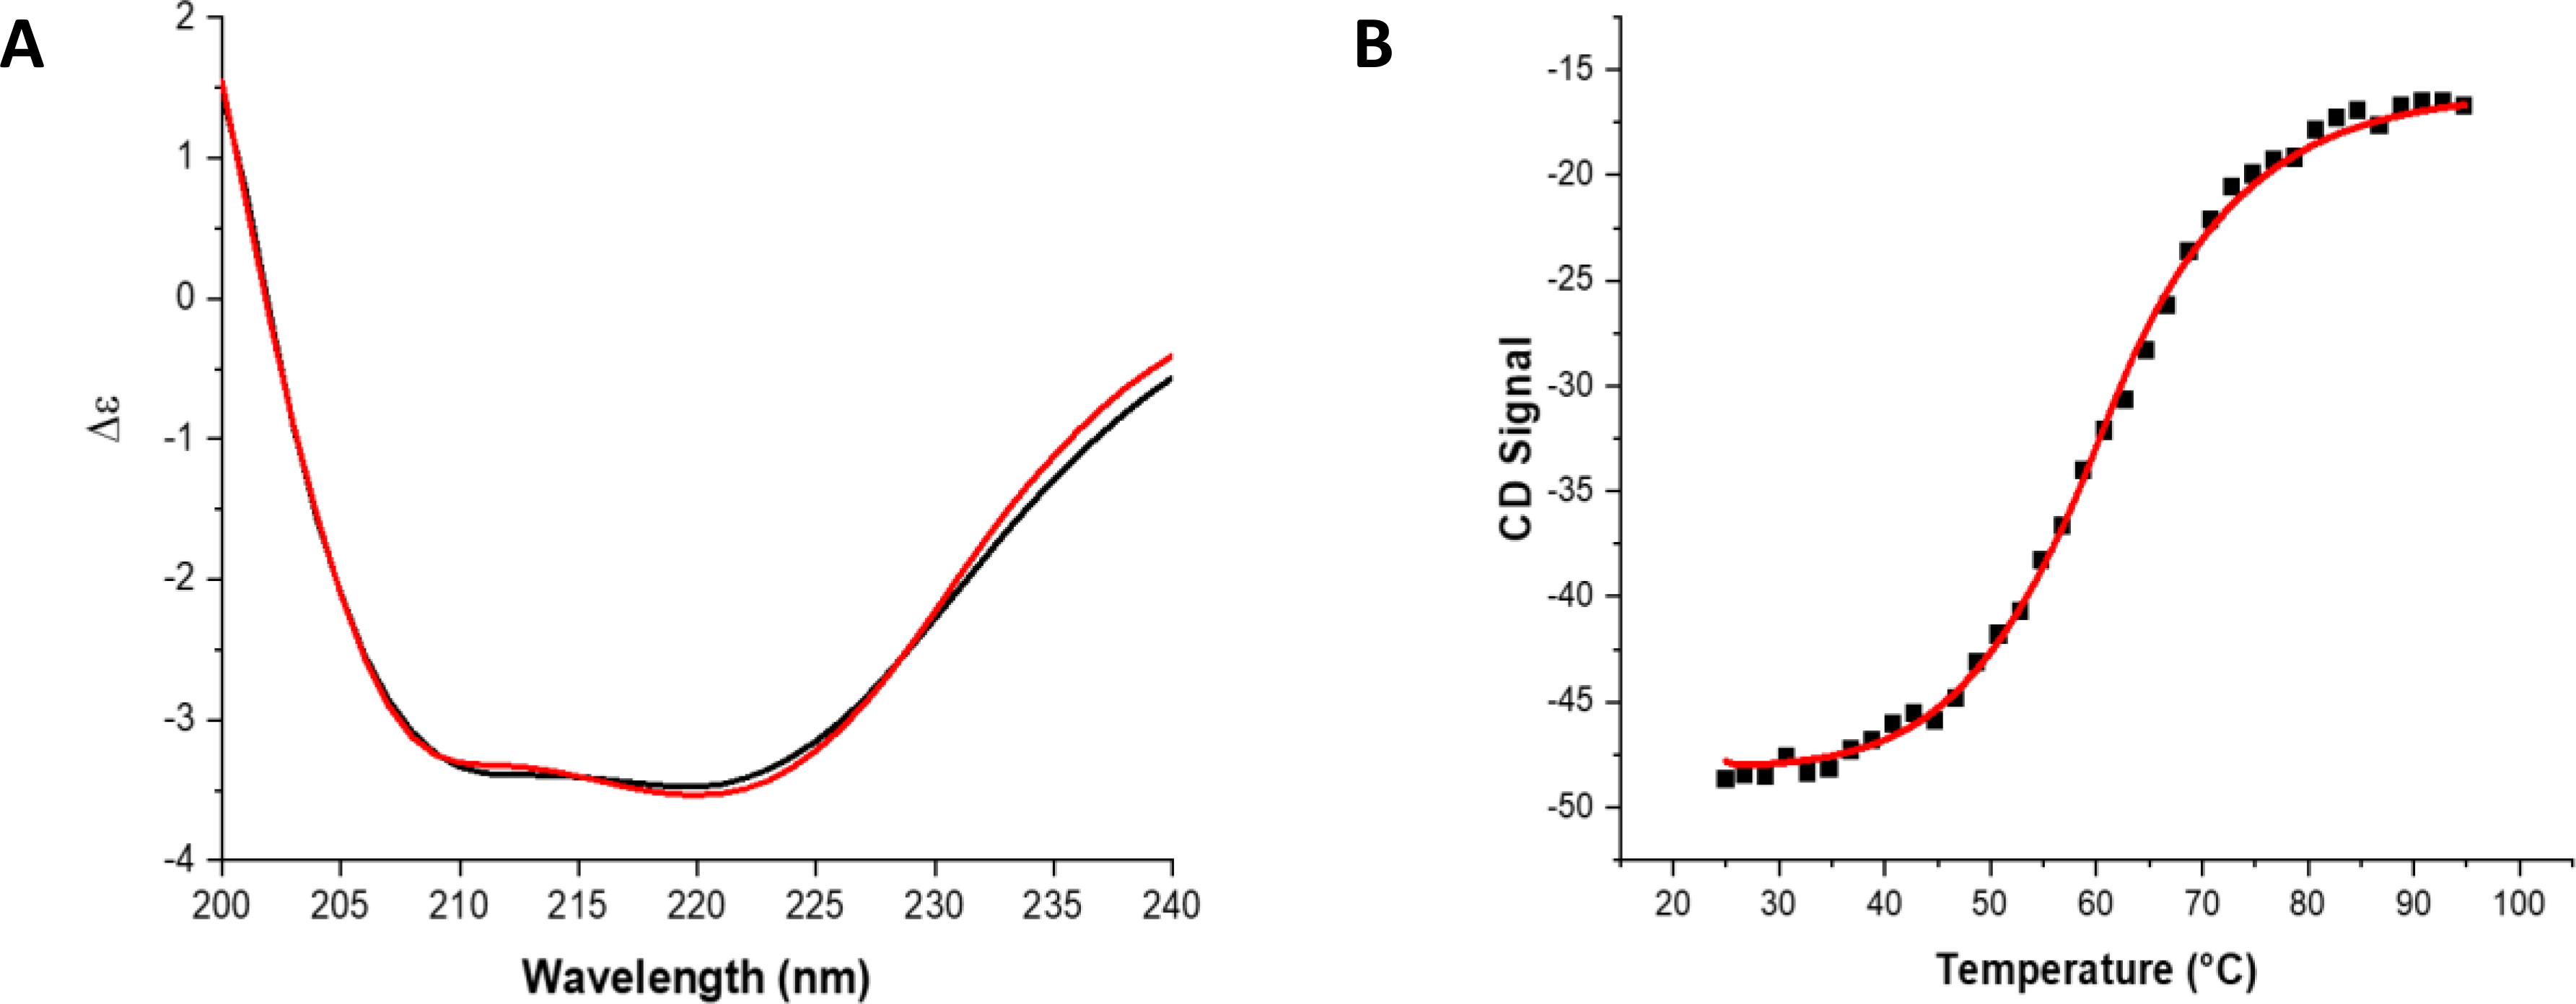
CD spectra and VT-CD melt of apo-SyNfu. A) Overlay of 150 uM Sy-NifU CD spectra (black) and K2D3 prediction (red), B) VT-CD melt of 300 μM apo-SyNfu monitored at 222 nm in PBS buffer, pH 7.5.

CD spectra and VT-CD melt of apo-SyNfu. A) Overlay of 150 uM Sy-NifU CD spectra (black) and K2D3 prediction (red), B) VT-CD melt of 300 μM apo-SyNfu monitored at 222 nm in PBS buffer, pH 7.5.