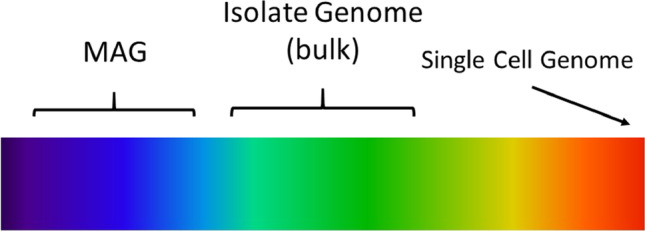
Fig. 1.

Genome heterogeneity spectrum. On the right are single-cell genomes, those that have no DNA heterogeneity from different cells. In the middle are isolate (bulk) genomes, those that may have some DNA heterogeneity from different cells, assuming all cells from which the genome was sequenced are from the same isolate. On the left are MAGs, which usually have DNA heterogeneity derived from genomes of different strains of the same species, when such strains are present in the sample from which the MAG was reconstructed
