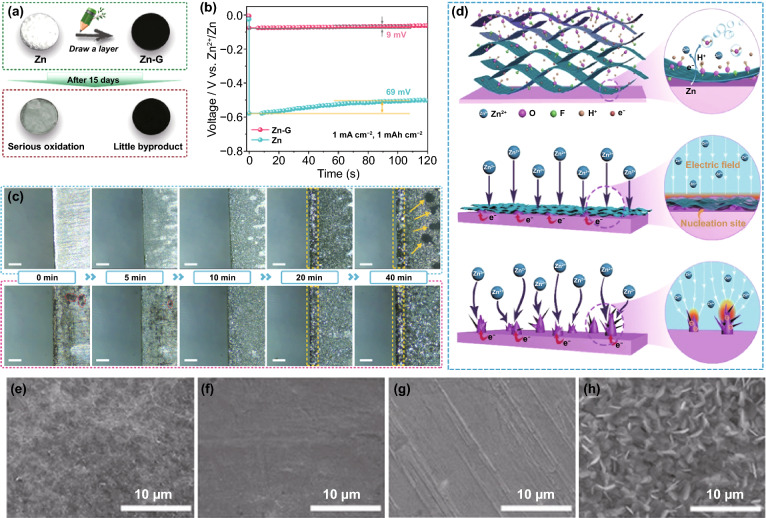
Fig. 6.
a Schematic illustration of the modification process and the stability in 2 M ZnSO4 electrolyte of Zn and graphite-coated Zn anode; b The voltage–time curves of Zn and Zn–G symmetric cells at 1.5 mA cm−2; c In situ optical microscope photographs of (top) Zn and (bottom) Zn–G electrodes observed by symmetric transparent cells under various deposition times [78].
Copyright 2020, Wiley–VCH. d Illustration of (top) synchronously reducing and assembling MXene layer on the Zn foil surface; Illustration of Zn plating behavior of (middle) MXene-coated Zn, and (bottom) pure Zn; SEM images of MZn-60 and pure Zn e, g before cycling, and f, h after 100 cycles at 3 mA cm−2 [81]. Copyright 2020, Wiley–VCH

