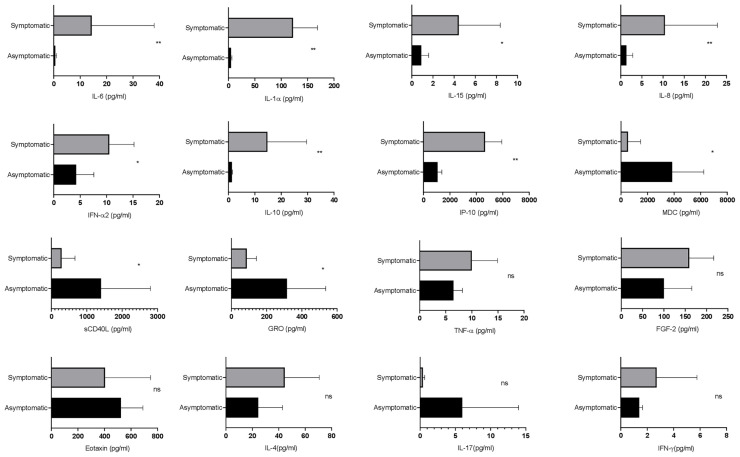
Figure 3.
Evaluation of the cytokine responses between asymptomatic and symptomatic COVID-19 patients. The bar diagram depicting the expression levels of cytokines in pg/ml. Cytokines were measured after disease onset between asymptomatic and symptomatic patients. The Mann–Whitney (non-parametric, two-tailed) test was performed. p < 0.05 was considered statistically significant (*), and p < 0.005 was considered to be very significant (**). ns, not significant. All error bars were SD.

