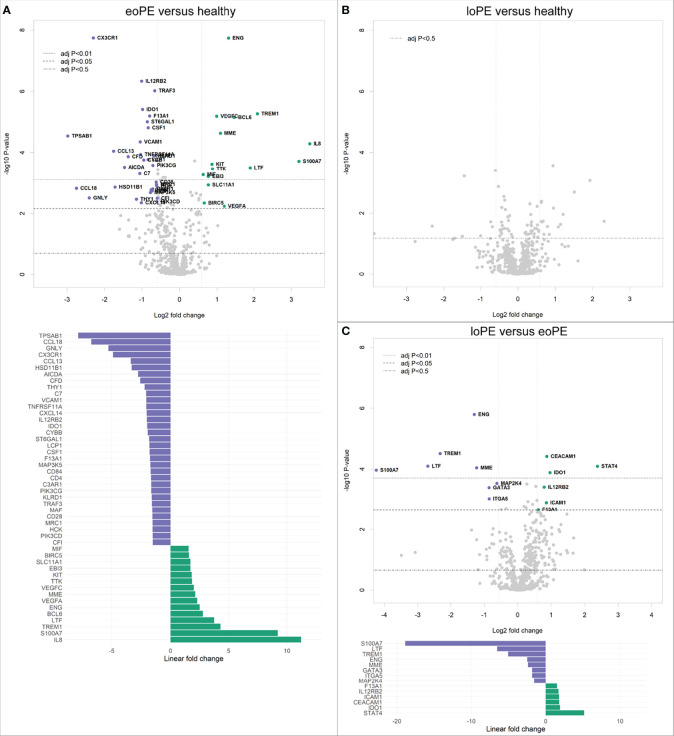
Figure 1.
Gene expression is altered in early-onset preeclampsia (eoPE) compared to healthy and late-onset preeclampsia (loPE) placentas. Differential gene expression analyses in early-onset preeclampsia compared to healthy (A), late-onset preeclampsia compared to healthy (B), and late-onset compared to early-onset preeclampsia placentas (C). Points with annotation in the volcano plots depict genes with an adjusted P-value < 0.05 and FOC > 1.5. The bottom graphs in panels (A, C) display the linear fold changes of the differentially expressed genes. The annotations represent the official gene names.

