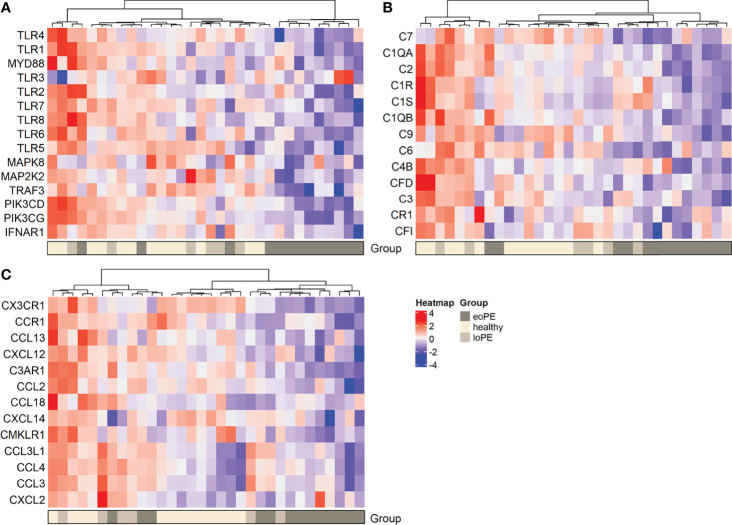
Figure 3.
Heatmap hierarchical clustering displays lower expression of genes associated with the TLR pathway (A), complement activation (B), and chemokines (C) in early-onset preeclampsia placentas. Red depicts increased and blue depicts decreased mRNA expression scaled to the gene average. eoPE, early-onset preeclampsia; loPE, late-onset preeclampsia.

