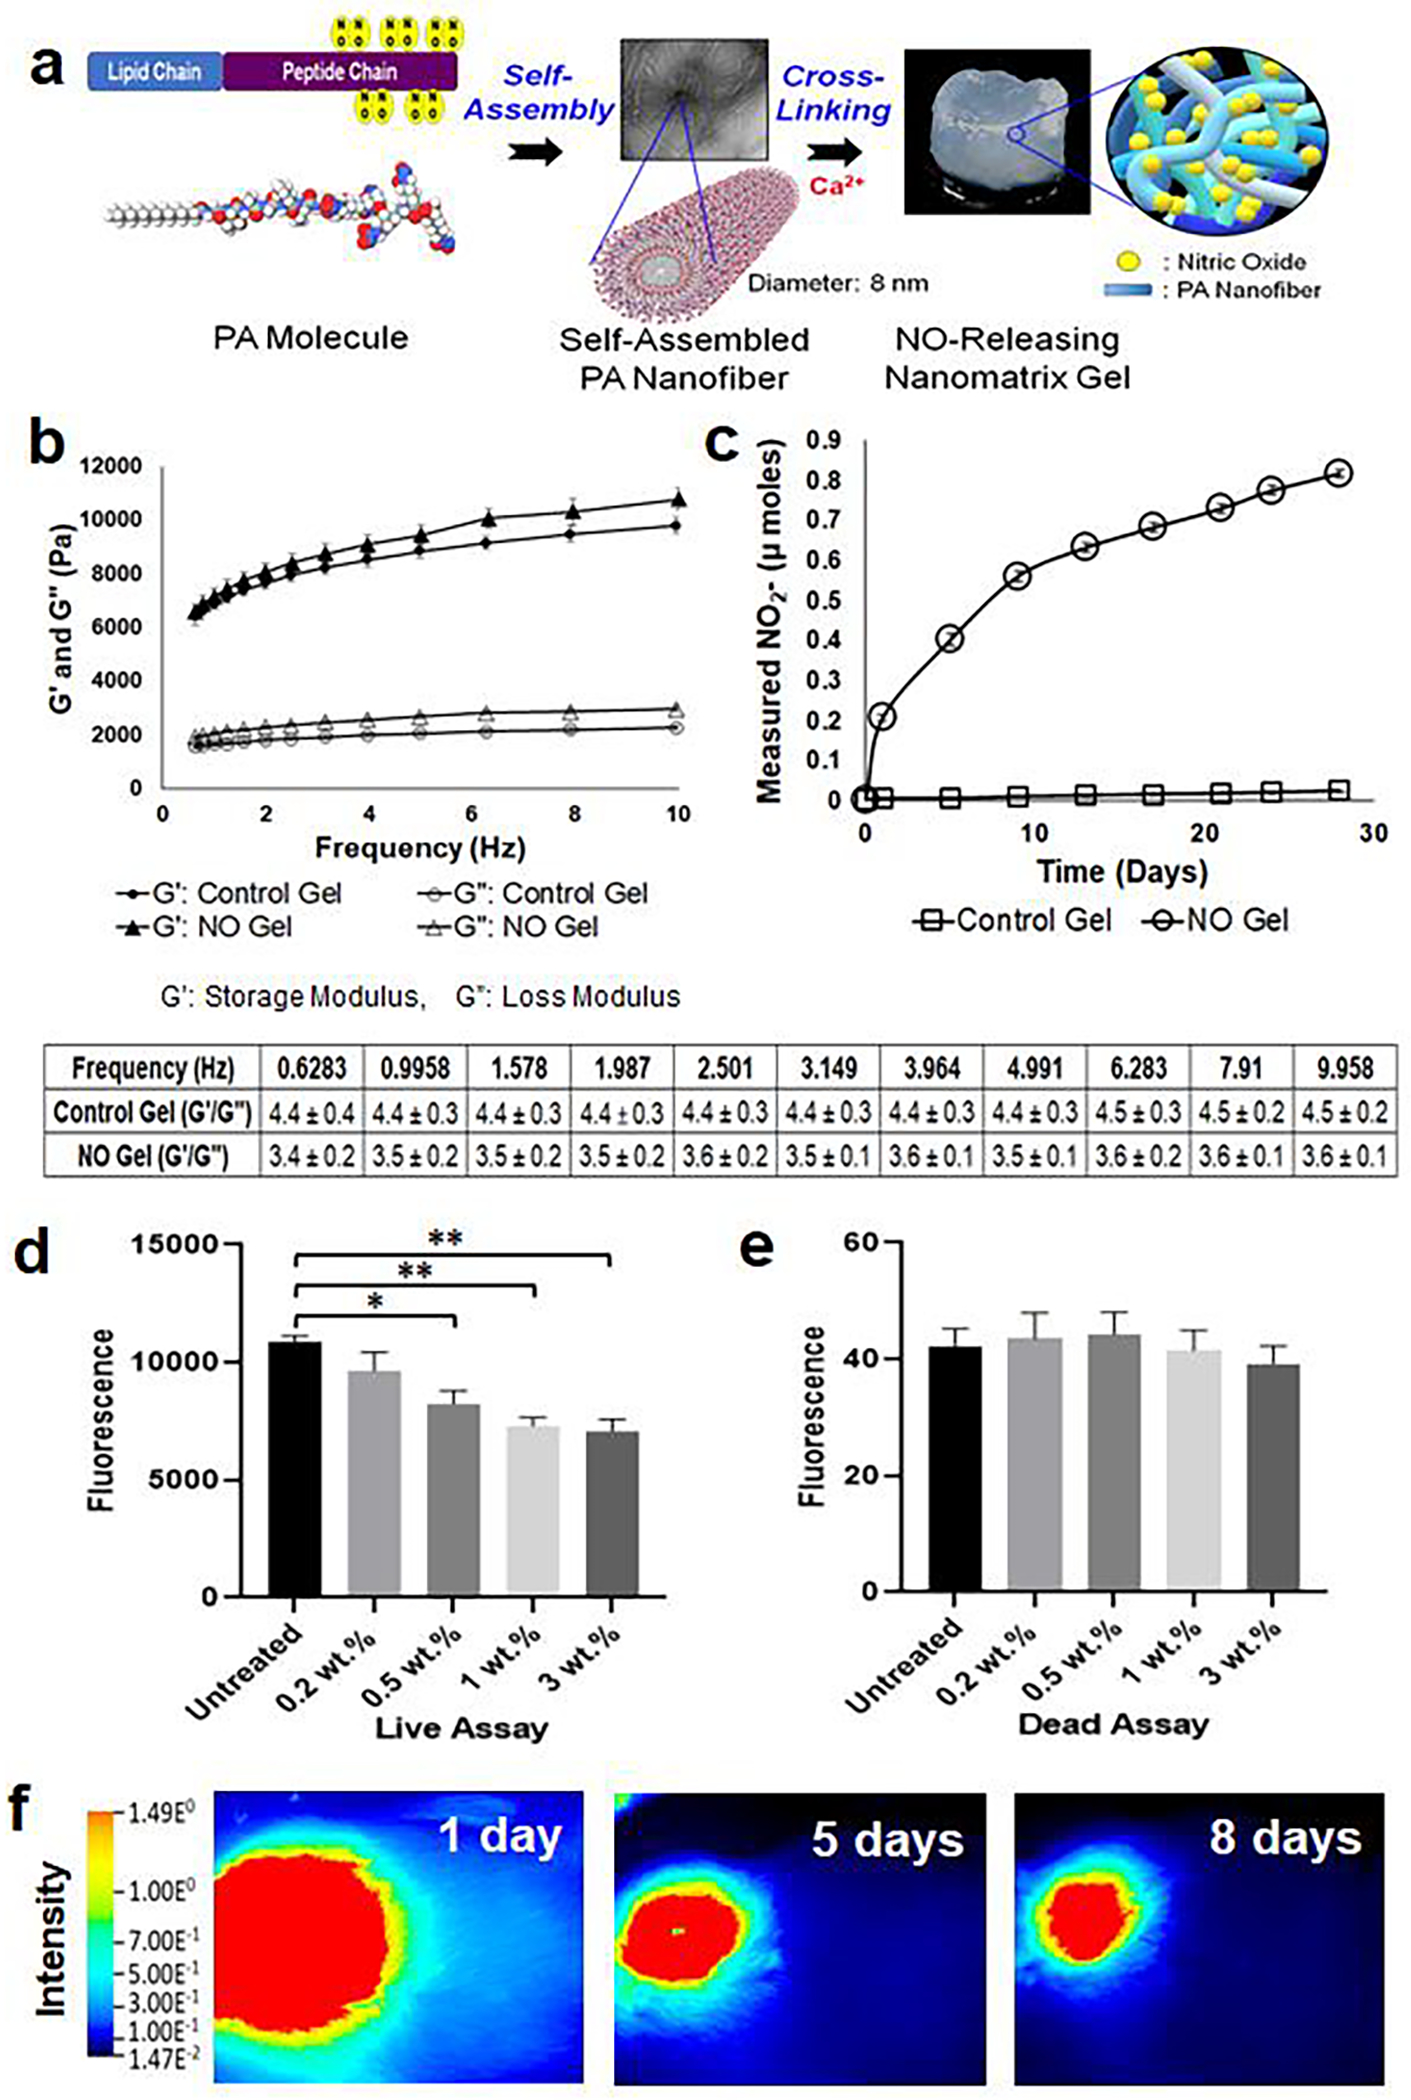
Fig. 3. Characterization of NO gel.

(a) Formation of NO releasing nanomatrix gel by self-assembly and cross-linking of PA molecules. (b) Measure of storage modulus (G’) and loss modulus (G”) of nanomatrix gels over various frequencies (0–10 Hz) using dynamic oscillatory rheometry at 37°C. G’/G” of nanomatrix gels is calculated in the table. Data are presented as the mean ± s.e.m. (n=4 of each group). (c) Evaluation of in vitro NO release profiles from nanomatrix gels for 28 days. NO released samples from each time point were analyzed using the total NO assay kit, which measured the nitrite (NO2-; primary degradation product of NO) and the reduced NO2- from nitrate (NO3-). Data are presented as the mean ± s.e.m. NO releasing nanomatrix gel (n=4) and control nanomatrix gel without NO (n=3). (d) Live and (e) dead assays on SMCs after 3-day culture with varied concentrations of PA-YK-NO (0.2, 0.5, 1, and 3 wt.%) containing nanomatrix gels. Data is presented as the mean ± s.e.m. (n=4 for each group). *p<0.05 and **p<0.01. An unpaired t-test was used to test for statistical differences between groups. (f) Degradation of NO releasing nanomatrix gel at the rat femoral AVF. The IR fluorescence dye was conjugated to the PA for in vivo visualization of gel using LiCOR Pearl Trilogy machine at various time points (up to 57 days; see Supplementary Fig. S3; representative images from one rat (n=3)).
