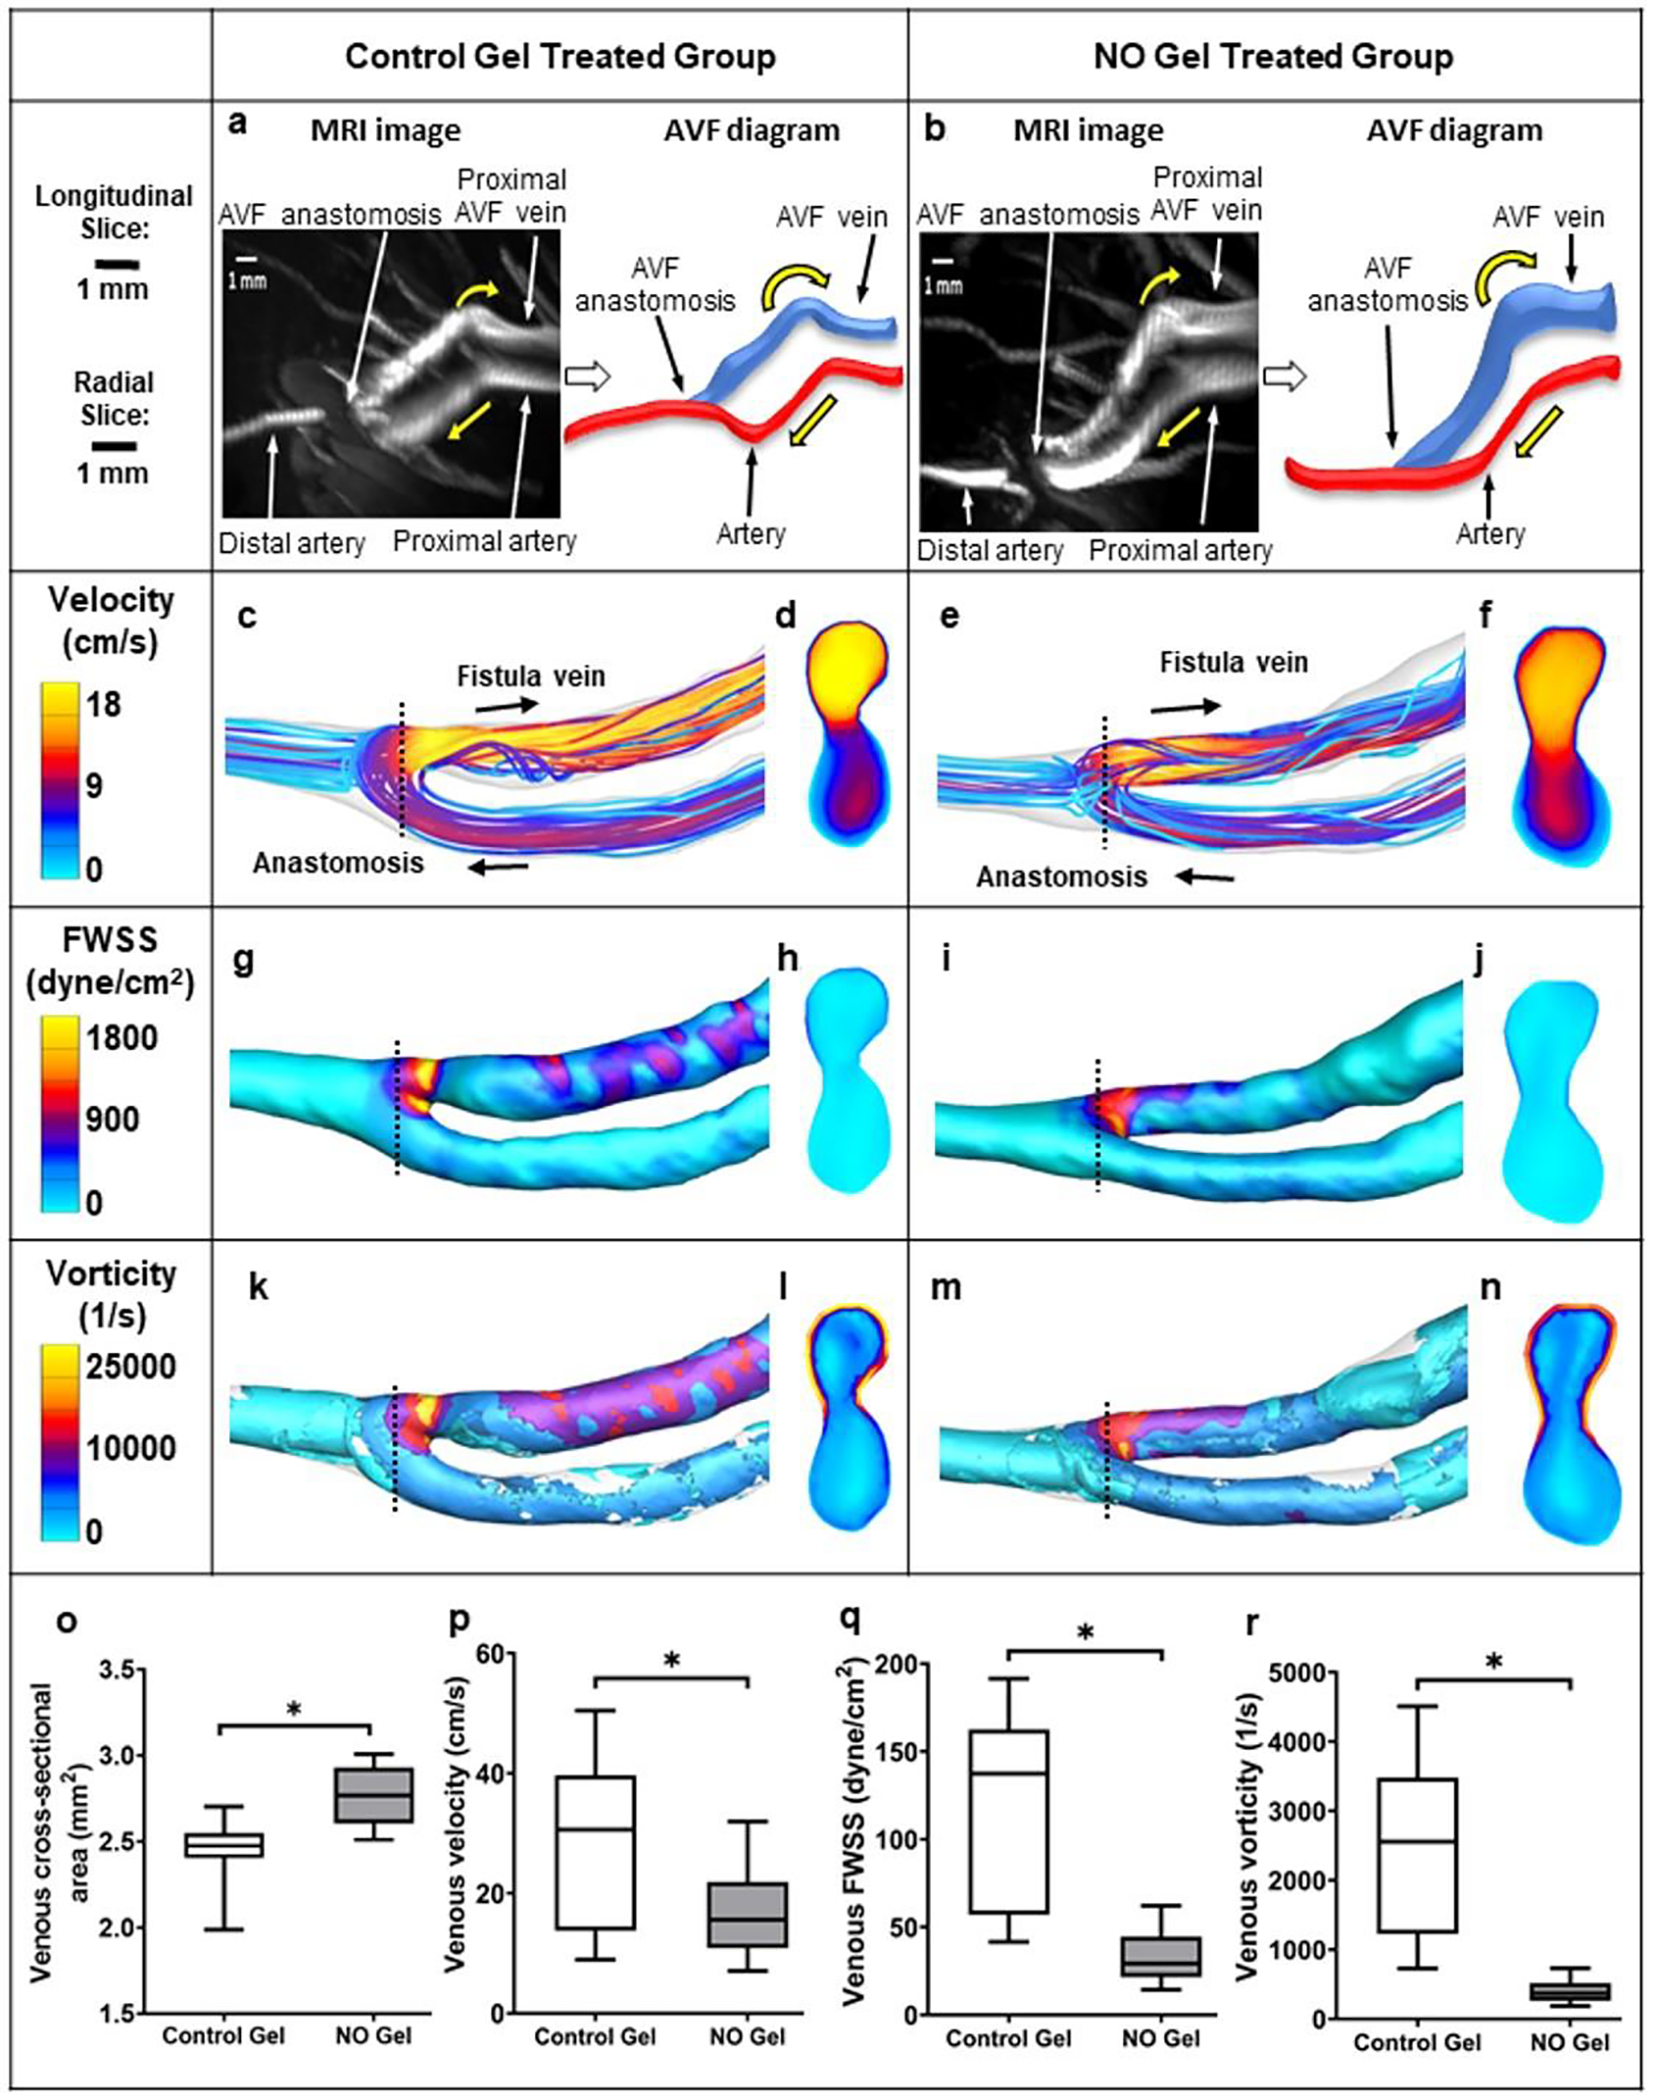
Fig. 7. Hemodynamics at the rat AVF at 7 days after NO gel treatment.

(a), (b) MRI images of rat AVFs treated with the control gel without NO and the NO releasing nanomatrix gel, respectively. Yellow arrow: blood flow direction. (c-n) Color maps of the velocity, FWSS, and vorticity, as well as the cross-section (located at the dashed black lines) of rat AVFs. Black arrow: blood flow direction. (o) venous cross-sectional area. (p-r) CFD quantifications of venous velocity, venous FWSS, and venous vorticity, respectively. Box and whisker plots present data from the 25th to 75th percentile with whiskers extending to the 5th and 95th percentile. (n=3 for the control gel treated group and n=4 for the NO gel treated group). *p<0.05.
