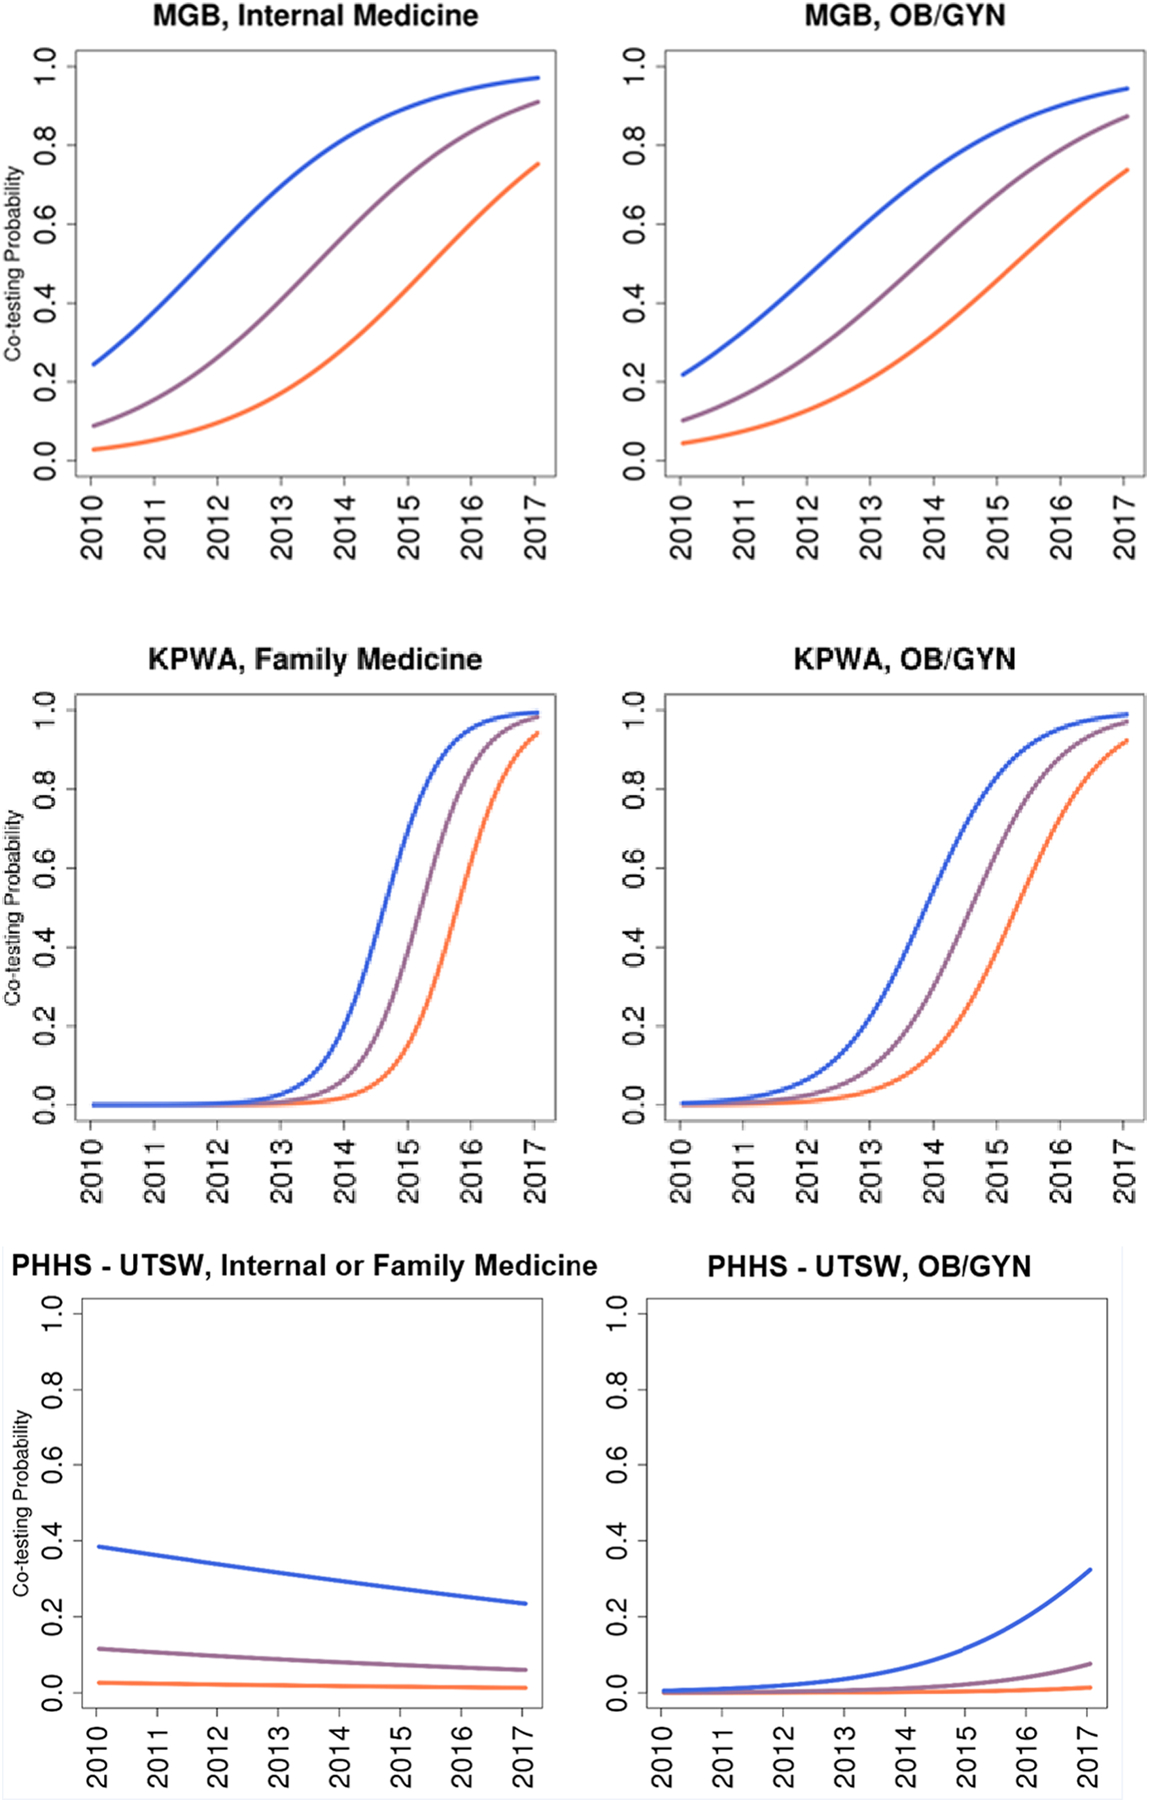
Figure 2.

Estimated Trends in Co-Testing Use by Provider Specialty and Healthcare System.
The different colors represent the estimated co-testing propensity over time for the most common screening population (45-year-old White woman with commercial insurance assuming an average facility-level random effect) and provider-level random effects at the 25th, 50th, and 75th percentiles.
MGB: Mass General Brigham
KPWA: Kaiser Permanente Washington
PHHS-UTSW: Parkland Health & Hospital System-University of Texas, Southwestern
