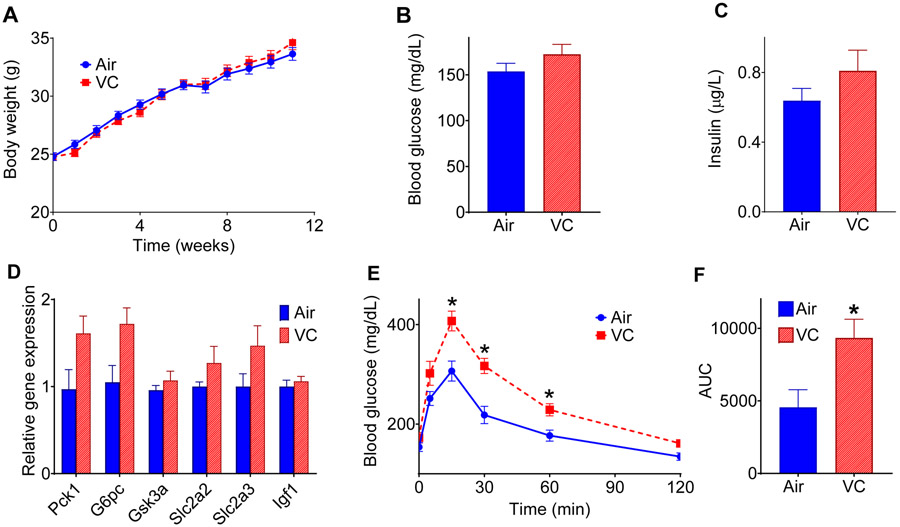
Figure 1: Metabolic changes in vinyl chloride-exposed mice.
(A) Mice were exposed to HEPA-filtered air (Air) or vinyl chloride (0.8 ppm) for 12 weeks, and body weights were measured at indicated time points (n = 25/group). (B) Blood glucose level at euthanasia. (C) Plasma insulin level at euthanasia. (D) The hepatic expression of genes involved in maintaining glucose homeostasis. (E) Glucose (1 g/kg; i.p.) tolerance test (GTT) in mice exposed to VC for 12 weeks. (F) The area under the curve (AUC) for GTT (n = 8/group). Values are mean ± SEM. *P < 0.05 vs air-exposed controls.

