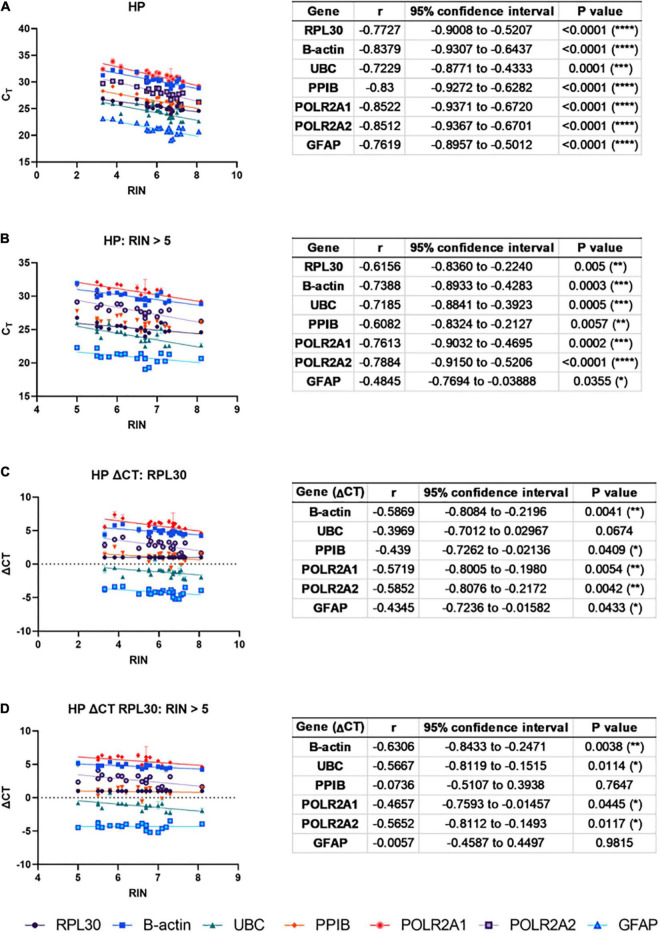
FIGURE 2.
RNA integrity number (RIN) is correlated with CT: To ascertain whether degraded total RNA affects mRNA quantification using qPCR, correlations between RIN and qPCR CT for six genes commonly used in qPCR studies of human brain tissue were made across pooled normal and AD HP cases. (A) Strong, negative correlations were observed between CT and RIN for all genes. (B) After excluding RIN values < 5, strong negative correlations were still observed for three out of six genes (B-actin, UBC, POLR2A), moderate negative correlations were observed for two out of six genes (RPL30, PPIB), and GFAP showed a weak, negative correlation. To mitigate this, CT values were normalized to RPL30 using the ΔCT method. (C) Moderate, negative correlations were still observed in two out of five genes (B-actin, POLR2A) and weak negative correlations were observed in two out of five genes (UBC, PPIB). (D) Removing RIN values < 5 still produced moderate, negative correlations for two out of five genes (B-actin, UBC), and one gene showed a moderate or weak negative correlation depending on the primer pair used (POLR2A).

