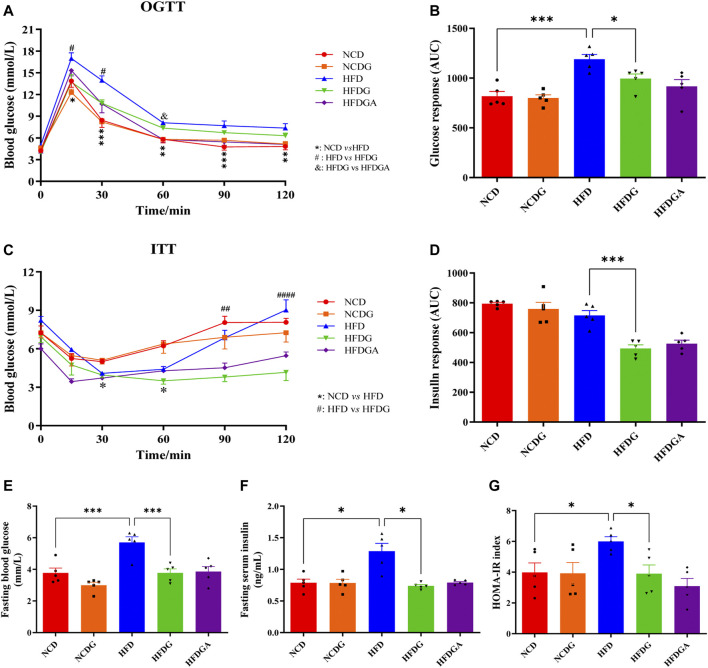
FIGURE 2.
DG reduced glucose intolerance and insulin resistance in mice fed with high fat diet. (A, C) OGTT and ITT in each group, respectively. (B, D) The calculated AUC for OGTT and ITT, respectively. (E, F) Fasting blood-glucose and insulin, respectively. (G) HOMA-IR based on the formula. Values were denoted as mean ± SEM (n = 5). *p < 0.05; **p < 0.01; ***p < 0.001. Abbreviations: DG, diammonium glycyrrhizinate. OGTT, oral glucose tolerance test. ITT, insulin tolerance test. AUC, area under the curve. HOMA-IR, homeostasis model assessment of insulin resistance.

