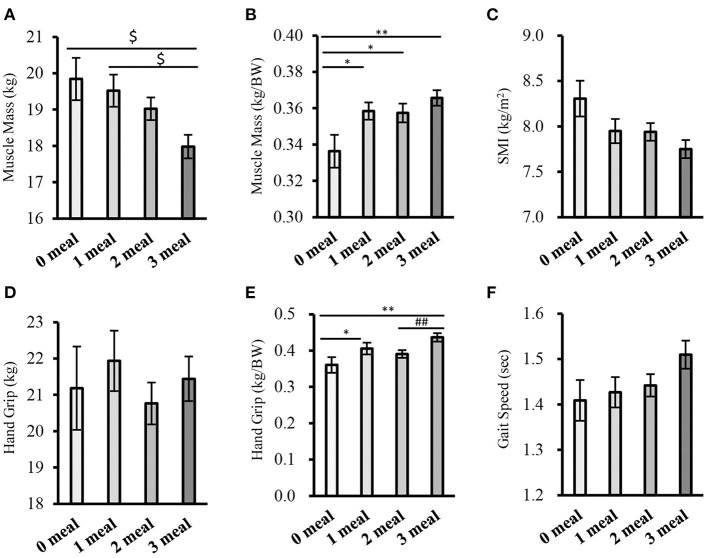
Figure 3.
Comparison of sarcopenia-related factors by the number of meals meeting 0.4g/kg BW (cross-sectional study 2-1). (A) Muscle mass, (B) Muscle mass (corrected for body weight), (C) SMI, (D) Handgrip strength, (E) Handgrip strength (weight-corrected), (F) Gait speed. Values are expressed as mean and standard error. $P < 0.05 compared to 3 meals (one-way ANOVA), *P < 0.05, **P < 0.01 compared to 0 meal (Mann-Whitney), ##P < 0.01, compared to 3 meals (Mann-Whitney), BW, Body Weight; SMI, Skeletal Muscle Index.

