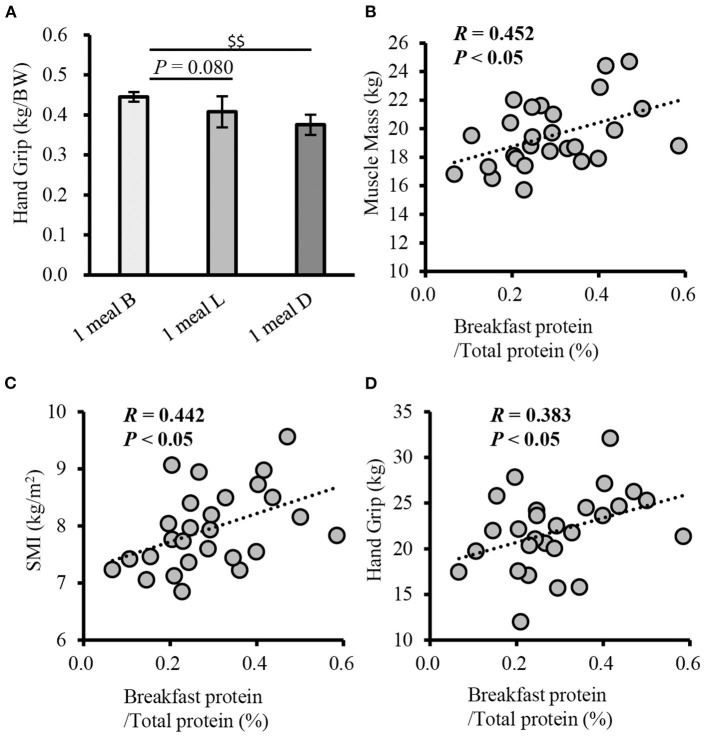
Figure 5.
Comparison of handgrip strength between patterns with only one meal of adequate protein intake, and correlation of the rate of breakfast protein intake with physical function (cross-sectional study 2-3). (A) Comparison of grip strength between patterns with only one meal of adequate protein intake, Correlation between muscle mass (B), SMI (C), handgrip strength (D), and the rate of breakfast protein intake. Values are expressed as mean and standard error. $$P < 0.01, compared to 1 meal D (one-way ANOVA). Pearson's product-moment correlation coefficient. SMI, skeletal muscle index; B, breakfast; L, lunch; D, inner.

