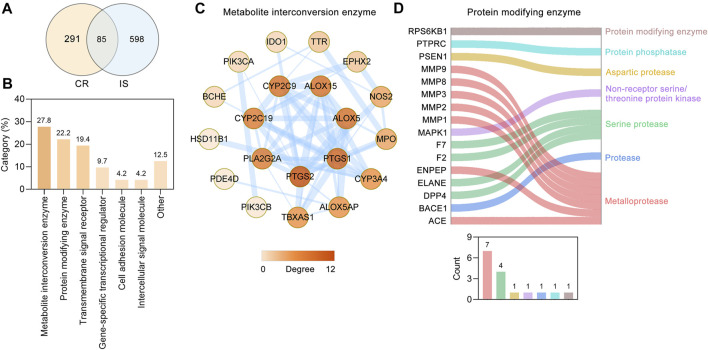
FIGURE 3.
Protein functional classification of targets of CR against IS. (A) Venn diagram showing overlapping targets between the CR and IS targets. (B) Protein functional classification of 85 common targets. Numbers above bars represent the percentage of the protein in the given functional class. (C) PPI network of 20 targets involved in metabolite interconversion enzyme (PC00262). Higher the degree of a node, the darker the color of the node. The edges thickness is proportional to the combined score. (D) Sankey diagram of 16 targets involved in protein modifying enzyme (PC00260). The bar chart below the sankey diagram represents the number of targets involved in each classification.

