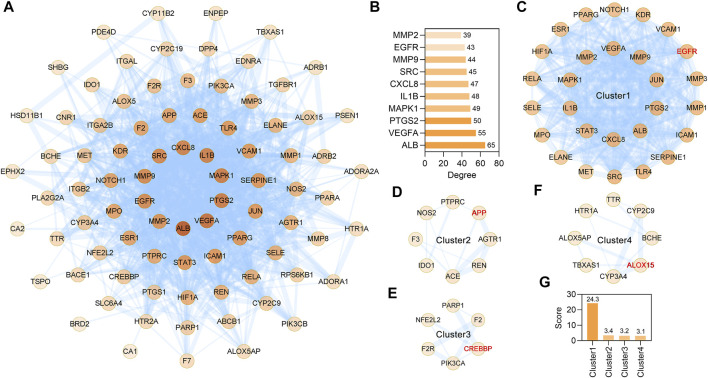
FIGURE 4.
MCODE network clustering analysis of common targets between the CR and IS. (A) The PPI network was constructed for the 85 potential targets of CR against IS. The darker the node, the greater the degree. The edges thickness is proportional to the combined score. (B) The top 10 core targets were extracted from (A). (C–F) The four tightly connected network clusters were identified by MCODE algorithm. The seed node of each cluster is indicated by red font. (G) Comparison of MCODE scores for different clusters.

