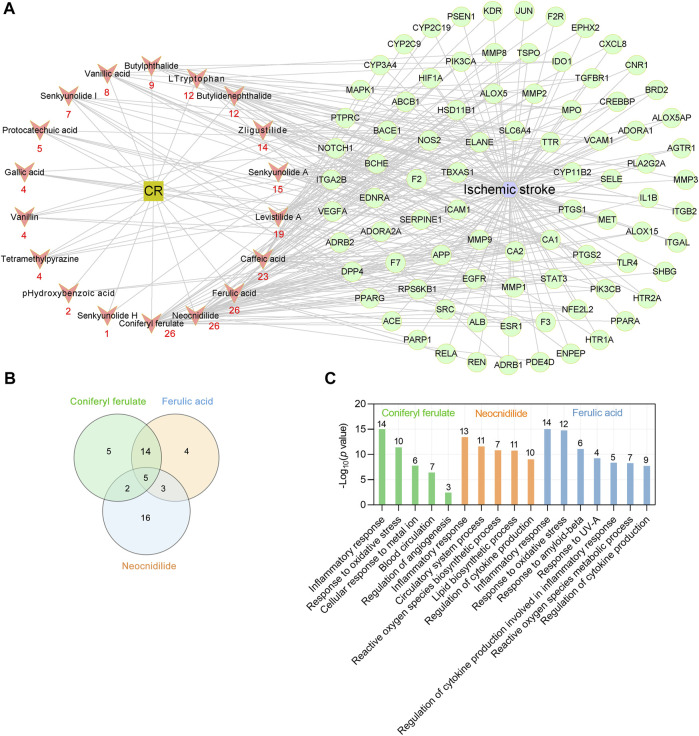
FIGURE 5.
Key phytochemicals of CR in treating IS. (A) CR main phytochemicals target-IS target network. Red nodes represent the main phytochemicals in CR, and red numbers below these nodes represent the number of CR targets against IS. Green circular nodes represent 85 common targets between the CR and IS. (B) Venn plot showing the number of overlapping potential targets among the three key ingredients. (C) Enriched GO biologic process for top three key phytochemicals -related targets. Numbers above bars are the number of targets enriched in terms.

