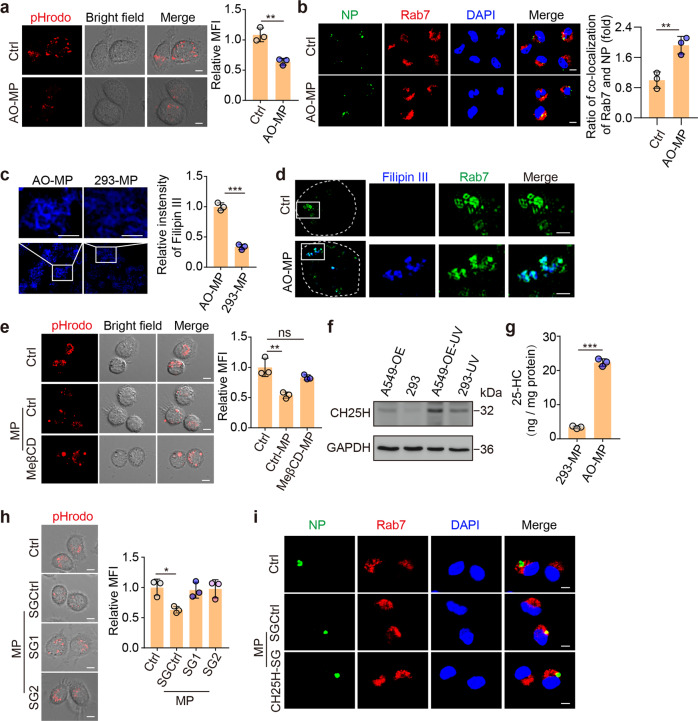
Fig. 4.
Oxidized cholesterol increases the endosomal pH and disrupts viral entry into the cytosol a AMs were pretreated with 5 × 10⁵ AO-MPs for 30 min, stained with pHrodo™ Red Dextran (red), and observed under a confocal microscope. Scale bar, 5 μm. b AO-MPs (5 × 10⁵) were incubated with 5 × 10⁴ TCID50 SARS-CoV-2 for 30 min at 37 °C and then used to infect AMs for 20 min. The cells were stained with anti-NP and anti-Rab7 (a marker for late endosomes) antibodies. Scale bar, 5 μm. c MPs were stained with filipin III and observed by ultrahigh-resolution structured illumination microscopy. Scale bar, 1 μm. d Filipin III-labeled MPs (5 × 10⁵) were incubated with AMs for 20 min, and then the cells were stained with anti-Rab7 antibodies. Representative cells are shown outlined by dashed white lines, and the boxed areas are magnified on the right. Scale bar, 1 μm. e The same as (a), except MPs generated from ACE2-overexpressing A549 cells (A549-OE) or MeβCD-treated A549-OE cells were used. Scale bar, 5 μm. f CH25H expression was detected by western blotting after UV irradiation. g The 25-HC levels in MPs were quantified by LC–MS/MS. h, i, The same as (a) and (b), respectively, except MPs were generated from A549-OE cells or CH25H-knockout cells. SG1 and SG2 are guide RNAs for knocking out CH25H. Scale bar, 5 μm. The data represent the mean ± SD of three independent experiments. ns no statistical significance, * p < 0.05, ** p < 0.01, *** p < 0.001; two-tailed Student’s t test (a–c, g) or one-way ANOVA (e, h)

