
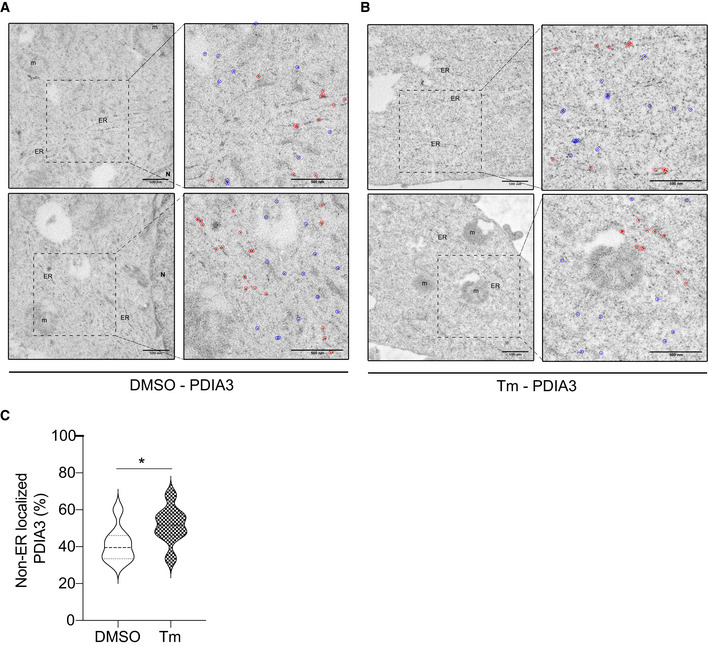
Figure 4. PDI proteins are redistributed to the cytosol during ER stress.
-
A, BRepresentative transmission electron microscopy images of the gold particles distribution (after immunogold labeling with PDIA3 antibodies) in A549 cells treated with DMSO or Tm. In the inserts, gold particles in the ER were surrounded by red circles and those in the rest of the cytoplasm by blue circles. (Scale bar 500 nm). n represents the nucleus, and m represents the mitochondria.
-
CViolin plots of the gold particles distribution from the electron microscopy experiment (immunogold labeling of PDIA3) as shown in (B, C) *P‐value = 0.0486. n = 8 for DMSO and n = 8 for Tm. Thick horizontal lines represent mean ± SD ‐lighter dashed lines. Differences were analyzed by Unpaired Student’s t‐test using Prism 9 (GraphPad).