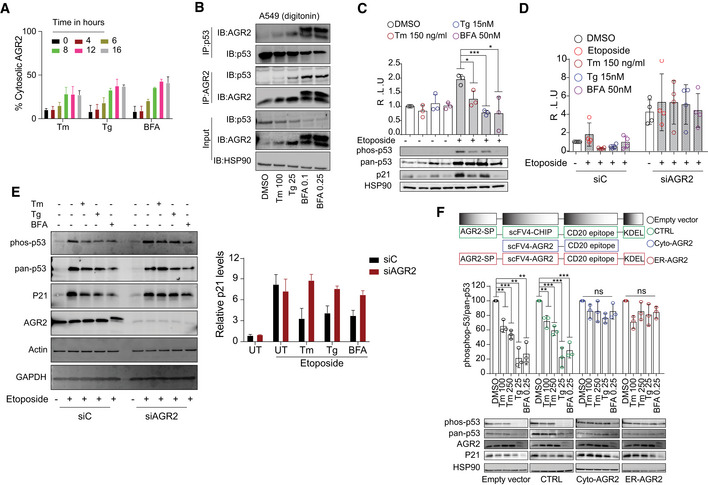
Quantification of the subcellular protein fractionation of AGR2 in A549 cells treated with Tunicamycin (Tm), Thapsigargin (Tg), and Brefeldin‐A (BFA) for different time points as shown in Appendix Fig S3A–C. n = 3, biological replicates (mean ± SD. Differences were analyzed using Prism 9 (GraphPad), except when otherwise indicated.
Immunoprecipitation of p53 and AGR2 in the digitonin fraction of A549 cells. A549 cells were treated with Tunicamycin (Tm 100 ng/ml), Thapsigargin (Tg 25 nM), and Brefeldin A (BFA 0.1 and 0.25 nM). Endogenous p53 was immunoprecipitated from the cytoplasmic fraction (digitonin fraction) of A549 cells. Coprecipitated endogenous AGR2 was detected by Western blot.
A549 were treated with Etoposide (Eto) for 2 h to induce p53 pathway. Then, cells have been challenged with Tm, Tg, and BFA at the indicated concentrations for 16 h. Luciferase experiments were performed after 24 h of transfection. Graph shows the fold induction of p53 luciferase construct. Western blot experiments for phospho‐p53, pan‐p53, p21, and HSP90 were performed as control. n = 3, biological replicates (mean ± SD; Differences were analyzed by Unpaired Student’s t‐test using Prism 9 (GraphPad), except when otherwise indicated. *P < 0.05, ***P < 0.001.
A549 were transfected with control siRNA (siC) and AGR2‐tergetd siRNA (siAGR2). After 24 h, cells were transfected with p53‐luciferase construct. Cells were then treated as in (C), and luciferase experiments were performed. n = 4, biological replicates (mean ± SD. Differences were analyzed by Unpaired Student’s t‐test using Prism 9 (GraphPad), except when otherwise indicated.
Left: Western blot experiments for phospho‐p53, pan‐p53, and p21 in AGR2‐silenced A549 cells exposed to ER stressors: 100 ng/ml Tunicamycin (Tm), 25 nM Thapsigargin (Tg), and 0.25 nM Brefeldin A (BFA), in the presence and absence of etoposide. Right: Quantification of the Western blot. n = 3, biological replicates, mean ± SD.
A549 were transfected with the indicated constructs of differently targeted nanobodies, cells were then treated with Tunicamycin (Tm 100 ng/ml and 250 ng/ml), Thapsigargin (Tg 25 nM), and Brefeldin A (BFA 0.25 nM) for 16 h at the indicated concentration. Western blot experiments were performed, and HSP90 were used as loading control. n = 3, biological replicates mean ± SD of n = 3 independent experiments (***P < 0.001 and **P < 0.01). Differences were analyzed by Unpaired Student’s t‐test using Prism 9 (GraphPad), except when otherwise indicated.