Figure 3.

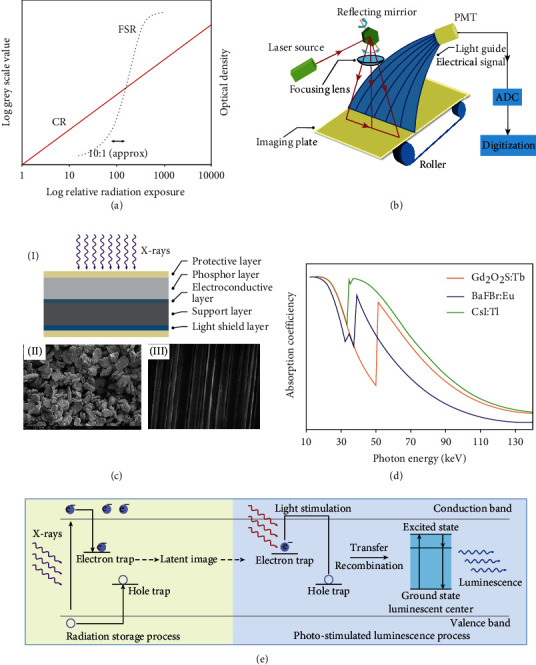
Computed radiography and its imaging mechanism. (a) The characteristic exposure curve of film-screen radiography (FSR, blue dotted line) and computed radiography (CR, red line). The film-screen radiography shows a linear exposure range of 10 : 1, and the digital radiography shows a linear exposure of 104 : 1. (b) Schematic diagram showing a typical computed radiography reader system and the corresponding image readout process. (c) Schematic diagram of the cross-section of the imaging plate (I). Scanning electron microscope (SEM) image of the structured (III) and unstructured (II) phosphors. (d) X-ray absorption spectra of thallium-doped cesium iodide (CsI: Tl, green), terbium-doped gadolinium oxysulphide (GOS: Tb, orange), and europium-doped barium fluobromide (BaFBr: Eu2+, blue) as a function of X-ray photon energy. (e) The physical process of photostimulation using BaFBr: Eu2+ phosphors. It can be divided into two steps, including radiation storage (light yellow) and photostimulated luminescence (light blue). The X-rays penetrating the object are absorbed by phosphors, creating a lot of electron-hole pairs, which subsequently migrate to emitting centers or are captured by metastable energy traps. Electrons and holes in the metastable energy traps absorb low-energy laser irradiation to overcome the energy barrier, escaping from the traps, followed by recombination at emitting centers to generate photostimulated luminescence. (a, b) are reprinted with permission from ref. [38], copyright 2007 Elsevier Ltd. (d) is reprinted with permission from ref. [41], copyright 2007 American College of Radiology.
