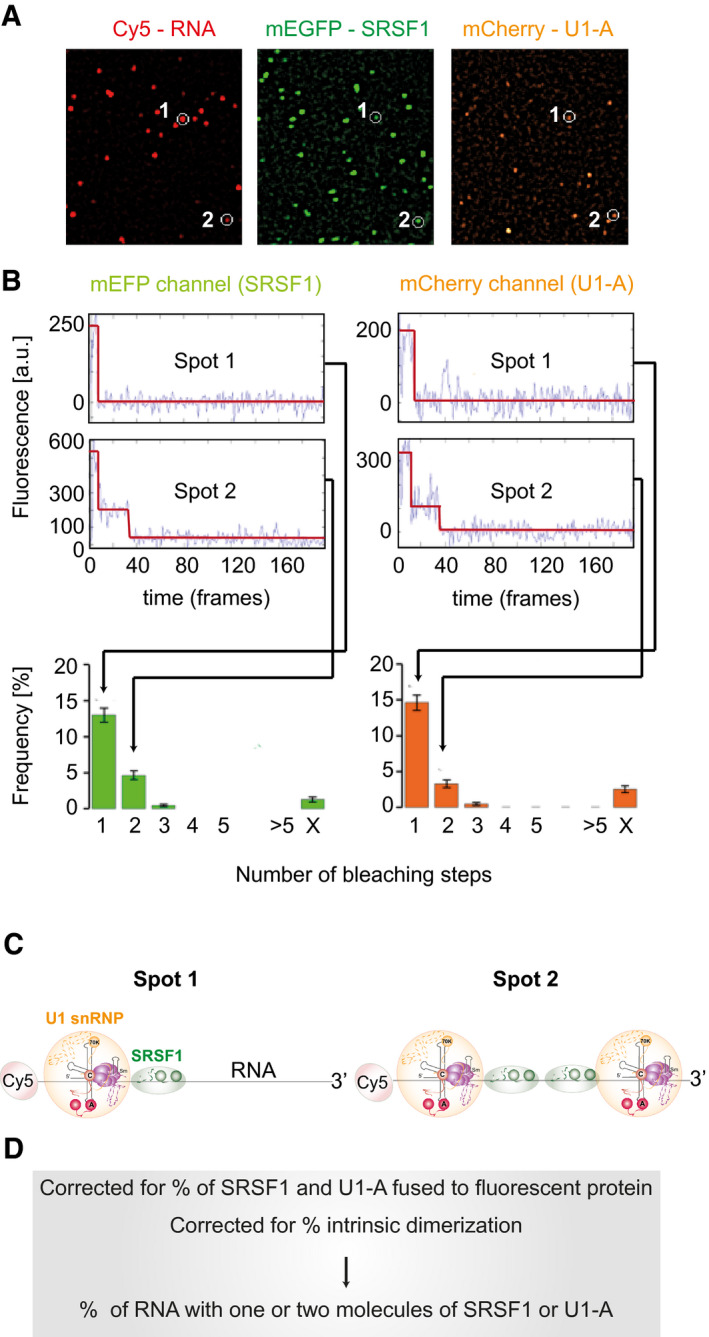
Figure 1. Representation of methods used for determining the frequencies with which 1, 2, etc., molecules of fluorescent protein are associated with pre‐mRNA.

- After incubation of Cy5‐labelled pre‐mRNA in a nuclear extract expressing mEGFP‐SRSF1 and mCherry‐U1A, samples are diluted and applied to a coverslip. Fluorescent images are acquired at time frames of 20–100 ms from excitation successively at 633 nm (to detect Cy5), 561 nm (to detect mCherry) and 488 nm (to detect mEGFP), and at each stage, collection continues until all the molecules have bleached. Cy5‐labelled RNA molecules (red) and mEGFP (green) and mCherry (orange) molecules are detected as spots in the composite images from each laser (Materials and Methods). Colocalized spots are identified (white circles); the other spots are not colocalized.
- Time courses of fluorescence are analysed to detect bleaching of the fluorophores in each spot. Two hypothetical molecular complexes are followed, one in which a molecule of RNA is associated with one fluorescent protein of each type (Spot 1) and the other in which it is associated with two fluorescent proteins of each type (Spot 2; either the result of binding to another site in the pre‐mRNA or dimerization). Each spot in which mEGFP bleached in one step contributes to the frequency of the N = 1 class; each spot in which it bleached with two steps is added to the N = 2 class, etc. The proportions of RNA spots associated with mEGFP signals that bleach in one, two, etc., steps are shown as a frequency histogram.§
- Inferred compositions of Spot 1 and Spot 2. Note that the positions and mechanisms of binding are not revealed by this method. The 5′ Cy5 fluorophore on the pre‐mRNA is highlighted in red; the U1 snRNP is represented by an orange disc, containing a diagram of the U1 RNA secondary structure with solid spheres representing the structured domains of the Sm proteins and the U1‐specific proteins, lines showing extended regions of the protein structures and dashed lines showing unstructured regions, since it was detected by mCherry‐U1A fluorescence; SRSF1 is represented by a green ellipse, containing two darker green circles representing the two RNA‐binding domains, since it was detected by mEGFP fluorescence.
- The frequency of complexes containing one, two, etc., molecules of SRSF1 and U1 snRNPs is calculated by taking into account the relative levels of the endogenous, untagged proteins and the frequency of intrinsic dimerization of each protein.
