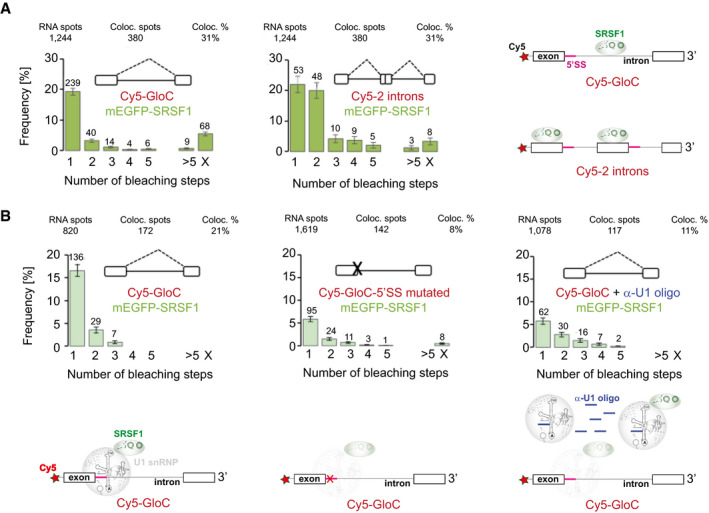
Figure 2. Dependence of stoichiometric SRSF1 association with pre‐mRNA on 5′ splice sites and U1 snRNA.

- Two‐way colocalization of mEGFP‐SRSF1 with Cy5‐pre‐mRNA containing one (left) or two (right) introns. In this experiment, nuclear extract (NE) 1 was used. The SRSF1 histograms are colour‐coded in three shades of green to indicate the extract used in each experiment shown. The number above each bar indicates the number of complexes in which complete bleaching was achieved in 1, 2, 3, etc., steps, and hence the number of complexes in which there were 1, 2, 3, etc., molecules of mEGFP‐SRSF1. > 5 refers to complexes where a higher number of bleaching steps were measured; X represents complexes where the number could not be determined. RNA spots refer to numbers of molecules of Cy5‐labelled pre‐mRNA detected in the fields acquired; Coloc. spots is the number of these associated with mEGFP‐SRSF1, and Coloc. % is the resulting percentage. The error bars are the square root of the variance of the binomial probability that an RNA spot will be associated with the given number of protein bleaching steps. The pre‐mRNA is represented above the histograms. For globin‐derived pre‐mRNA, the white boxes represent exons and the line in between is the intron. Potential splicing pathways are shown as dashed lines. The pre‐mRNA with two introns was formed by duplication of GloC sequences. The cartoons on the right show the inferences drawn from the histograms. The pre‐mRNA molecules are shown in grey, with the Cy5 label shown as a red star and 5′ splice sites as purple segments. From the histogram on the left we infer that, in those complexes where a molecule of pre‐mRNA was associated with SRSF1, only one molecule of SRSF1 (green) was present, while the histogram on the right shows that about half of the complexes of pre‐mRNA containing two introns were associated with two molecules of SRSF1.
- Two‐way colocalization of mEGFP‐SRSF1 with Cy5‐pre‐mRNA showing dependence of SRSF1 binding on 5′SS and U1 snRNP. Complexes formed in NE2 on GloC pre‐mRNA (left), a derivative with an inactivating mutation in the 5′SS mutant (centre) and on GloC in the presence of an additional 2′‐O‐methyl oligonucleotide complementary to the 5′ end of U1 snRNA (right). The last distribution is geometric (χ2, Pgeo = 0.72). Error bars are as described in (A). The interpretative cartoons underneath are based on the observed dependence of SFSF1 binding on U1 snRNPs and represent the possibility that in many cases, SRSF1 binding might be mediated by U1 snRNPs. SRSF1 is in green as in Fig 1, and the U1 snRNPs are in grey since they were not detected directly in this experiment. Paler colours indicate reduced levels of a labelled protein in the complex.
