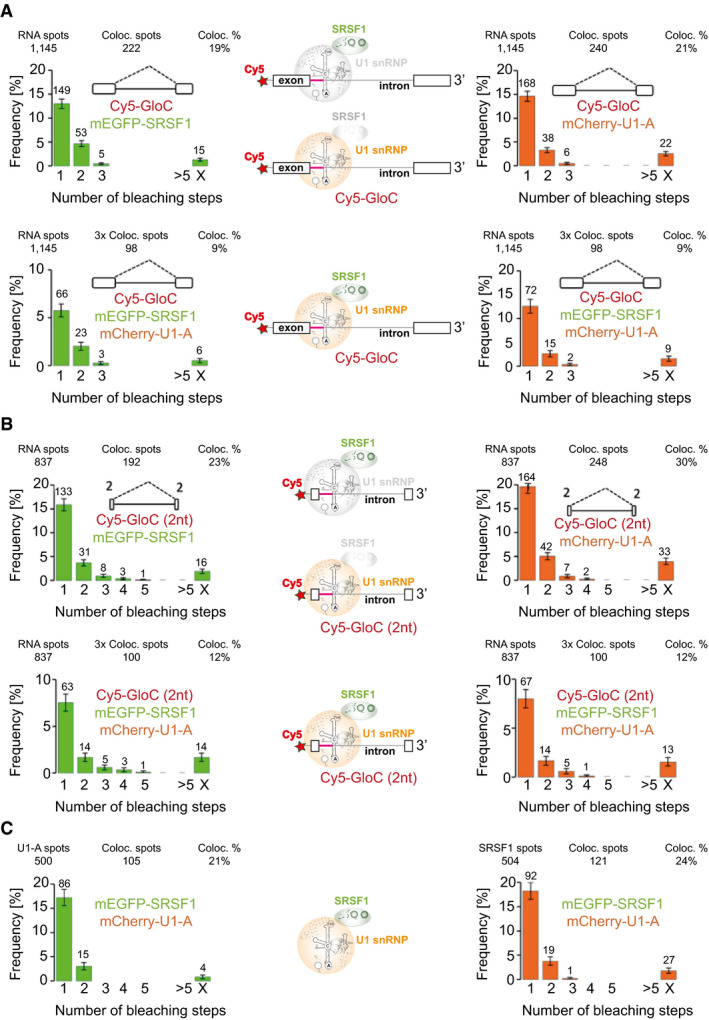
Complexes formed on GloC in NE3, containing labelled mEGFP‐SRSF1 and mCherry‐U1A, in which the distribution of mEGFP‐SRSF1 (left) and mCherry‐U1A (right) in two‐way colocalization with pre‐mRNA is shown; below, the respective distributions of mEGFP‐SRSF1 and mCherry‐U1A on 3‐way colocalized complexes. The error bars in the histograms are the square root of the variance of the binomial probability that an RNA spot will be associated with the given number of protein bleaching steps. The interpretative cartoons in the centre are based on the model in Fig
2B. The top cartoon, based on the upper‐left histogram, shows the majority of SRSF1‐pre‐mRNA complexes contain a single molecule of SRSF1, while U1 snRNPs are in grey to indicate that the data relate only to SRSF1; the lower cartoon, based on the upper‐right histogram, shows that most U1/pre‐mRNA complexes contain only one U1 snRNP, while SRSF1 is in grey to indicate that the data relate only to U1 snRNPs; the third cartoon, based on the lower two histograms, shows that complexes shown to contain both U1 snRNPs and SRSF1 contain only a single molecule of each componentt.

