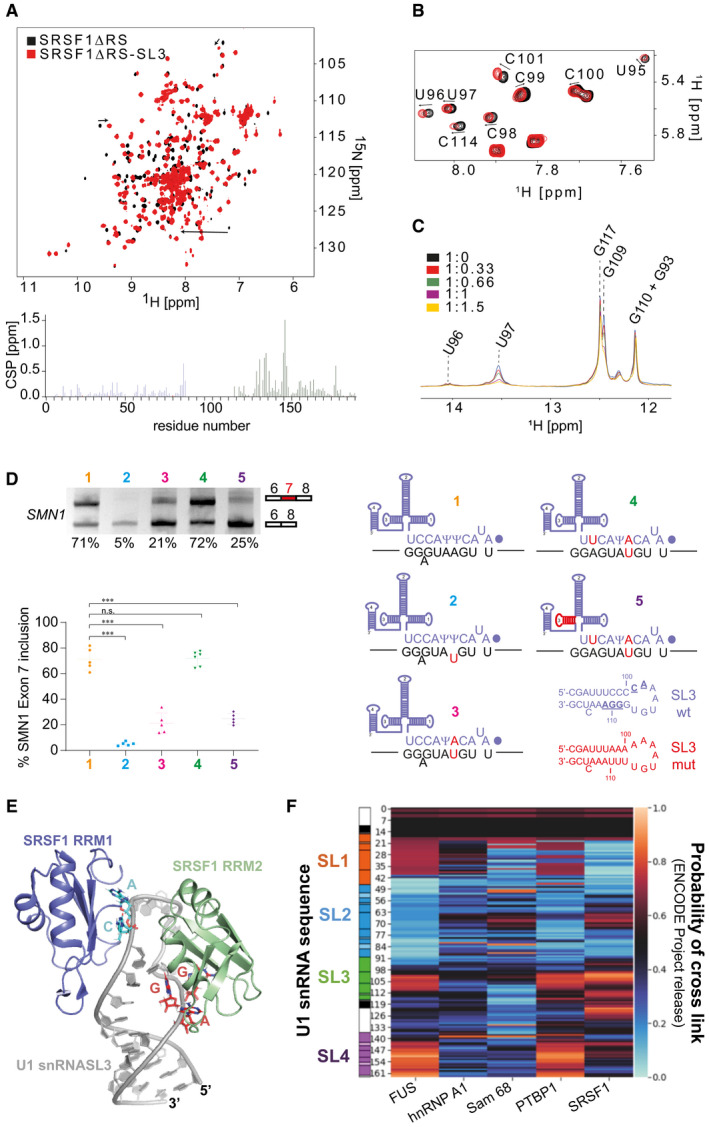
Overlay of the 2D 1H‐15N HSQC spectra of SRSF1∆RS before (black) and after addition of one equimolar amount of U1 snRNA SL3 (red). Bar plot showing the chemical shift perturbations (CSP) as a function of the residue number. Data corresponding to RRM1 and RRM2 are coloured in blue and green, respectively.
Overlay of the 2D 1H‐1H TOCSY spectra of U1 snRNA SL3 before (black) and after (red) addition of SRSF1∆RS.
Overlay of the 1D 1H SOFAST imino recorded upon successive addition of SRSF1∆RS. The spectra are coloured according to the SL3:SRSF1∆RS ratio.
Suppression of a 5′SS mutant by a complementary U1 snRNA is reduced by mutations of the nucleotides in U1 SL3 predicted to be bound by SRSF1. The diagram shows base‐pairing between the 5′ end of U1 snRNA and SMN1 exon 7. (1) Wild‐type sequences, with the dot representing the 2,2,7‐trimethylguanosine cap at the 5′ end of U1 snRNA and Ψ representing pseudouridine; a bulged A is shown. (2) A mutated nucleotide in the SMN1 exon 7 minigene that impairs base‐pairing with U1 snRNA is shown in red. (3) A compensating mutation was made in the gene encoding U1 snRNA. (4) An additional mutation was made in the U1 snRNA gene to improve base‐pairing with the SMN1 exon 7 5′SS. (5) The U1 gene containing two mutations that allow efficient suppression of the mutated exon 7 5′SS was mutated further in SL3, as shown by the sequences of SL3 below, to alter those nucleotides that interact with SRSF1 (underlined in the SL3 wt sequence) without affecting the base‐pairing in SL3. Minigenes expressing the wild‐type and mutated sequences of SMN1 exon 7 and U1 snRNA were transfected into HEK293T cells, and the level of inclusion of SMN1 exon 7 was detected by RT–PCR. The products were separated by agarose gel electrophoresis and detected by ethidium bromide. The scatter plot shows the percentage of exon 7 inclusion for the 5 conditions. The data points are shown as well as the mean and the standard deviation. One‐way ANOVA test was used to probe the significance of the data, and *** indicates that P < 0.005 (n = 5 biological replicates) while n.s. stands for non‐significant.
Structural model of the SRSF1∆RS‐SL3 complex.
Heat map showing the distribution of ENCODE cross‐links of selected proteins along U1 snRNA. The scale bar on the right‐hand side shows the probability that the cross‐links are enriched at a given position. The sequence of U1 snRNA, showing the stem‐loops, is aligned on the l.h.s.

