Fig. 4.
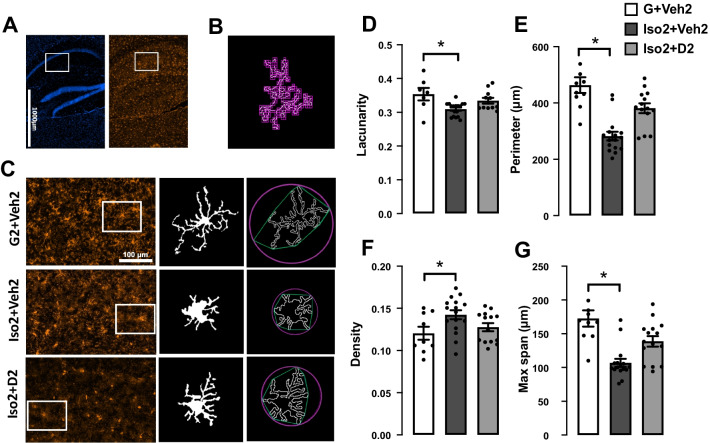
DHM treatment modulates microglia morphology in the CA1 and CA2 area of hippocampus. A Representative photos of the hippocampus CA1 where the white rectangular are regions for photomicrograph analysis, stained for DAPI (blue, left panel) and Iba-1 (red, right panel) from the control group. B Illustration for the box-counting method used for lacunarity calculation. C representative images for binary microglial and convex hull (green) and enclosing circle (pink) that were used to calculate density, perimeter, and maximum span across the hull, and the corresponding microglial in each group. D Microglial morphology profile illustrated in lacunarity, cell perimeter (E), density (cell area/convex hull area) (F), and the maximum span across the convex hull (G). One-way ANOVA followed by Sidak multiple comparisons test was used for statistical analysis. Each point represents individual microglia 3–4 cells from n = 5 mice, values represented as mean ± SEM, * = p ≤ 0.05

