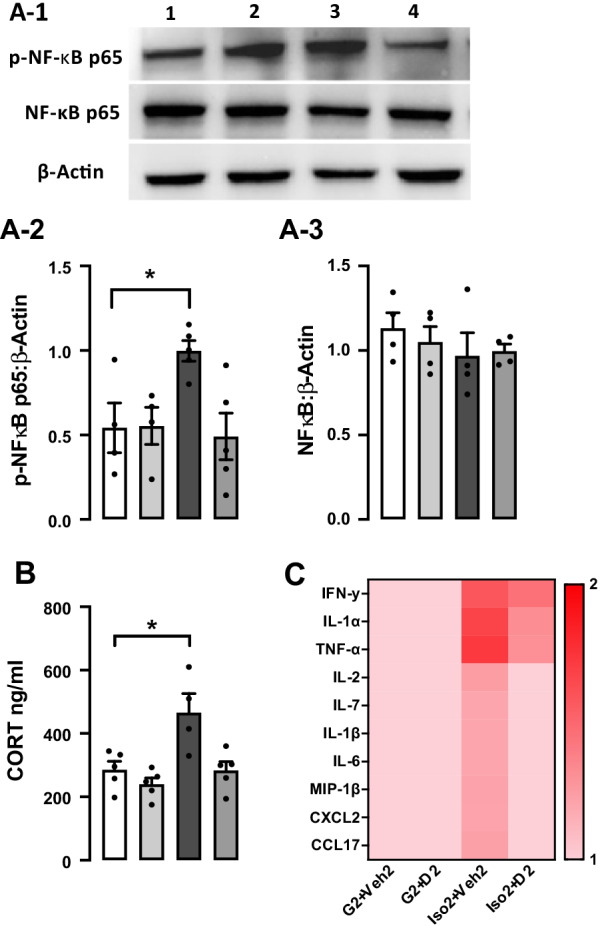
Fig. 5.

The effect of DHM on the levels of serum corticosterone, p-NF-kB p65 protein expression, and proinflammatory cytokines expression after social isolation. A1 Representative Western blots of phospho-NF-kB p65 (65 kDa), NF-kB p65 (65 kDa), and β -actin (42 kDa). A2 and A3 Quantitative analysis ratio for the protein expression of phospho-NF-κB p65 and NF-κB p65 with the loading control β-actin F (4, 10) = 1.485 p = 0.5885. B Serum level of corticosterone (ng/ml) after social isolation (Iso2 + Veh2) and following DHM treatment 2 mg/kg. One-way ANOVA followed by multiple comparisons, Holm–Sidak’s method. C Heat map of serum cytokines and chemokines level. The color key indicates response level ranging from the highest (red) to the lowest (pink). Data represented as the inverted mean gray value expressed in each cytokine/chemokine. Each data point was normalized to the baseline value (G2 + Veh2). (G2 + Veh) grouped housed vehicle, (G2 + D2) grouped housed DHM, (Iso2 + Veh2) socially isolated vehicle, (Iso2 + D2) socially isolated DHM, n = 4–5 per group. * = p ≤ 0.05 vs. group housing control (G2 + Veh2), n = 5/group
