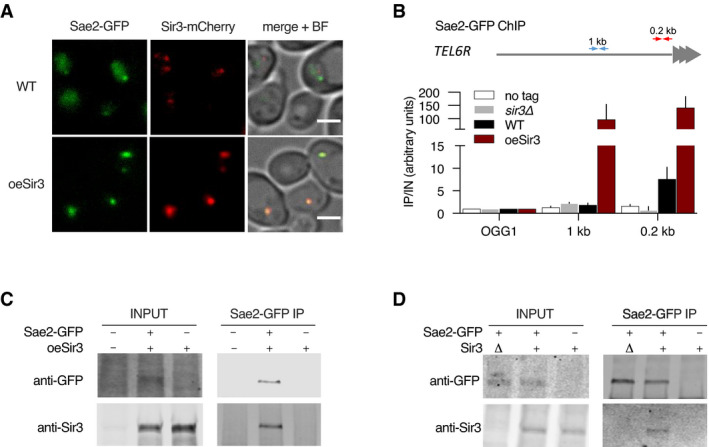
Figure 2. Sir3 and Sae2 physically interact.

- Representative images of Sir3‐mCherry and Sae2‐GFP signal in WT and SIR3 overexpressing cells. Scale bars are 2 μm.
- Sir3‐binding at TEL6R in untagged, WT, sir3Δ cells or in cells overexpressing Sir3 (oeSir3). Binding is probed by ChIP‐qPCR 0.2 (red arrows) and 1kb (blue arrows) from telomeres and at the OGG1 control locus using antibodies against Sae2‐GFP. The mean of three independent biological replicates is shown, and error bars correspond to the variation between replicates (SEM).
- Co‐immunoprecipitation between Sir3 and Sae2‐GFP from cells overexpressing Sir3, analysed by Western blot with anti‐GFP and anti‐Sir3 antibodies.
- Co‐immunoprecipitation between Sir3 and Sae2‐GFP from WT cells using antibodies against Sae2‐GFP, analysed by Western blot.
