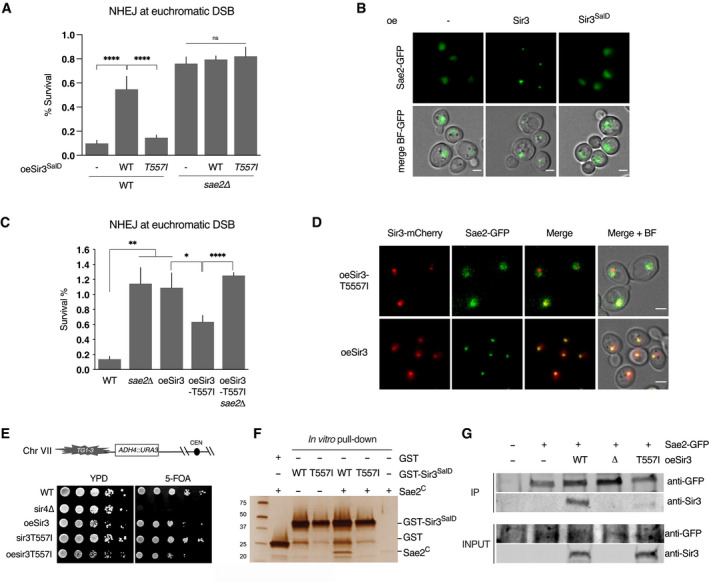
Figure 5. Sir3‐Sae2 interaction prevents Sae2 function and promotes NHEJ.

- Survival frequencies after DSB induction at LYS2 locus in WT or sae2Δ strains where the Sir3SaID or Sir3SaIDT557I domains are overexpressed from a GPD promoter at the SIR3 locus. Error bars indicate survival standard error (SEM) of at least three independent experiments.
- Representative images of Sae2‐GFP in WT cells and in cells overexpressing either full‐length Sir3 or the sir3SaID domain. Scale bars are 2 μm.
- Survival frequencies after DSB induction at LYS2 locus in the indicated strains. Error bars indicate survival standard error (SEM) of at least three independent experiments.
- Representative images of Sir3‐mCherry and Sae2‐GFP signal in cells overexpressing Sir3 and sir3T557I. Scale bars are 2 μm.
- Telomeric silencing assay at TEL7L in WT, sir4Δ, sir3T557I cells, cells overexpressing SIR3 (oeSIR3) or sir3T557I (oesir3T557I). Growth on 5‐FOA plates reflects telomeric silencing.
- Representative silver‐stained gels of in vitro GST‐pulldown of GST or GST‐Sir3SaID, GST‐sir3‐T557ISaID and Sae2C‐purified peptides. Control: Sae2C (300 ng, lane 6).
- Co‐immunoprecipitation between Sae2‐GFP and Sir3 from untagged, Sae2‐GFP WT cells, and Sae2‐GFP cells overexpressing WT Sir3 (oeSir3, WT), Sae2‐GFP sir3Δ or Sae2‐GFP overexpressing the sir3‐T557I mutant (oeSir3, T557I) using antibodies against Sae2‐GFP, analysed by Western blot with anti‐GFP and anti‐Sir3 antibodies.
Data information: Significance was determined using 2‐tailed, unpaired Student’s t‐test. *P‐value 0.01 to 0.05, significant; **P‐value 0.001 to 0.01, very significant; ****P < 0.0001, extremely significant; P ≥ 0.05, not significant (ns).
