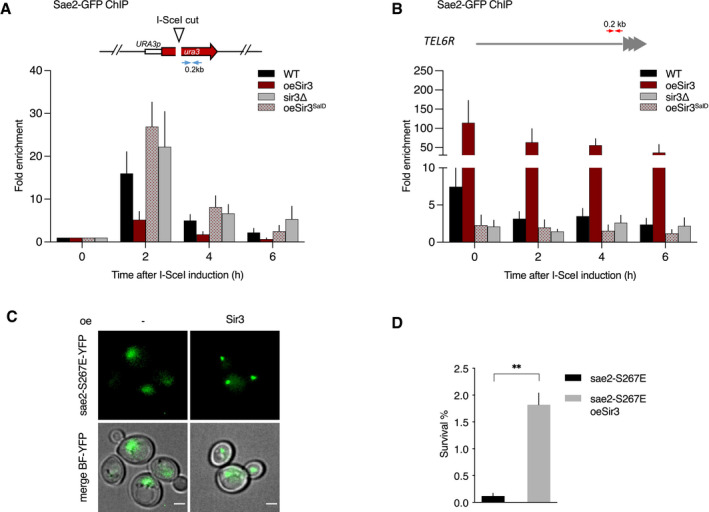
Figure 7. Modulation of Sae2 recruitment and activity by Sir3.

- Relative fold enrichment of Sae2 at 0.2 kb from I‐SceI site was evaluated by qPCR after ChIP with anti‐GFP antibodies. The error bars indicate the variation between at least three biological replicas (SEM).
- Relative fold enrichment of Sae2 at 0.2 kb from TEL6R after DSB induction at the LYS2 I‐SceI site was evaluated by qPCR after ChIP with anti‐GFP antibodies. The error bars indicate the variation between at least three biological replicas (SEM).
- Representative images of sae2‐E267E mutant cells overexpressing or not full‐length Sir3. Scale bars are 2 μm.
- Survival frequencies after DSB induction at LYS2 locus in sae2‐E267E mutant cells overexpressing or not full‐length Sir3 (oeSir3). Error bars indicate survival standard error (SEM) of at least three independent experiments.
Data information: Significance was determined using 2‐tailed, unpaired Student’s t‐test. *P‐value 0.01 to 0.05, significant; **P‐value 0.001 to 0.01, very significant; ***P‐value 0.0001 to 0.001, extremely significant; ****P < 0.0001, extremely significant; P ≥ 0.05, not significant (ns).
