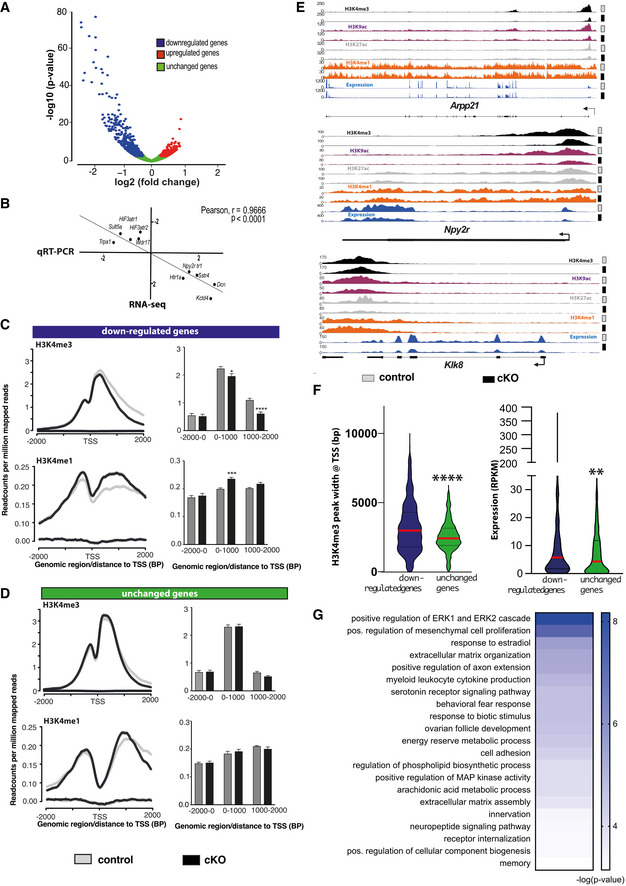
Figure 3. Hippocampal Setd1b controls highly expressed learning and memory genes characterized by a broad H3K4me3 peak.

- nucRNA‐seq experiment. Volcano plot showing genes differentially expressed in hippocampal CA neurons of Setd1b cKO mice. n = 3/group.
- Randomly selected genes that were either significantly up‐ (5 genes) or downregulated (5 genes) in the RNA‐seq dataset comparing control vs Setd1b cKO mice were tested via qPCR for validation. The graph shows the corresponding log2 (fold changes) in each experiment. The RNA‐seq and qPCR results show highly significant correlation.
- Profile plots showing H3K4me3 and H3K4me1 at the TSS of genes downregulated in Setd1b cKO mice. Bar plots (right panel) show quantification (Student's t‐test: *P‐value < 0.05, ***P‐value < 0.001, ****P‐value < 0.0001).
- Profile plots showing H3K4me3 and H3K4me1 at the TSS of a random set of genes (equal in number to downregulated genes) that were not altered in Setd1b cKO mice. Bar plot (right panel) shows quantifications.
- Genome browser views showing the 4 analyzed histone modifications and the gene expression pattern for Arpp21, Npy2r, and Klk8 as genes that were previously shown to be involved in synaptic plasticity and learning and memory. Please note that the H3K4me3 peak width is substantially shrinking in Setd1b cKO mice. At the same time there is an obvious increase of H3K4me1 at the TSS of Arpp21 in Setd1b cKO mice.
- Left panel: H3K4me3 peaks are significantly broader in genes that are downregulated in Setd1b cKO mice, when compared with a random set of genes of equal number that were unaffected. Right panel: Genes downregulated in Setd1b cKO mice are characterized by higher baseline expression when compared with a random set of genes of equal number that were unaffected (Mann–Whitney test: ****P‐value < 0.0001, **P‐value < 0.01).
- Heat map showing functional pathways affected by genes downregulated in Setd1b cKO mice.
Data information: Bar graphs indicate mean, Error bars indicate ± SEM. “n” indicates biological replicates. Violin plots: the dashed center line indicates the median, while the upper and lower dotted lines represent the 75th and 25th percentiles, respectively.
