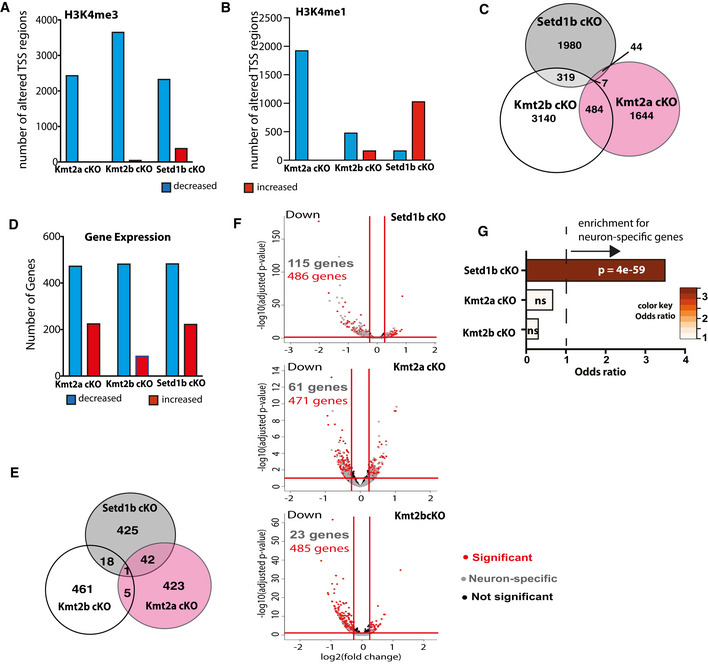
Figure 4. Comparative analysis of the hippocampal epigenome and transcriptome in Setd1b, Kmt2a, and Kmt2b cKO mice reveals specific regulation of neuron‐enriched genes in Setd1b cKO mice.

- Bar chart showing the number of TSS regions (± 2 kb) that exhibit significantly altered H3K4me3 (Kmt2a: control, n = 5; cKO, n = 3. Kmt2b: control, n = 6; cKO, n = 5. Setd1b: control, n = 4; cKO, n = 4).
- Bar chart showing the number of TSS regions (± 2 kb) that exhibit significantly altered H3K4me1.
- Venn diagram comparing the TSS regions with significantly decreased H3K4me3 in the 3 respective cKO mice.
- Bar chart showing the number of differentially expressed genes from bulk RNA‐seq in each of the 3 KMT cKO mice. Kmt2a: control, n = 5; cKO, n = 6. Kmt2b: control, n = 8; cKO, n = 11. Setd1b: control, n = 6; cKO, n = 6).
- Venn diagram comparing the significantly downregulated genes amongst the 3 respective cKO mice.
- Volcano plots showing differential gene expression in the three KMT cKO mice (data from bulk RNA‐sequencing results is compared here) together with the overlay of neuron‐specific genes. Although the total number of downregulated genes in each KMT cKO are comparable, more neuron‐specific genes are affected in Setd1b cKO, followed by Kmt2a cKO and Kmt2b cKO.
- Downregulated genes with concomitantly decreased H3K4me3 in each of the 3 KMT cKO mice were tested for the overlap to the 836 neuron‐specific genes we had defined for the hippocampal CA region (See Fig EV4). Only for Setd1b cKO mice a highly significant odds ratio (Fisher’s exact test) was observed, while there was no significant association among neuron‐specific genes and the genes affected in Kmt2a cKO or Kmt2b cKO mice.
Data information: Bar graphs indicate mean, Error bars indicate ± SEM. “n” indicates biological replicates.
