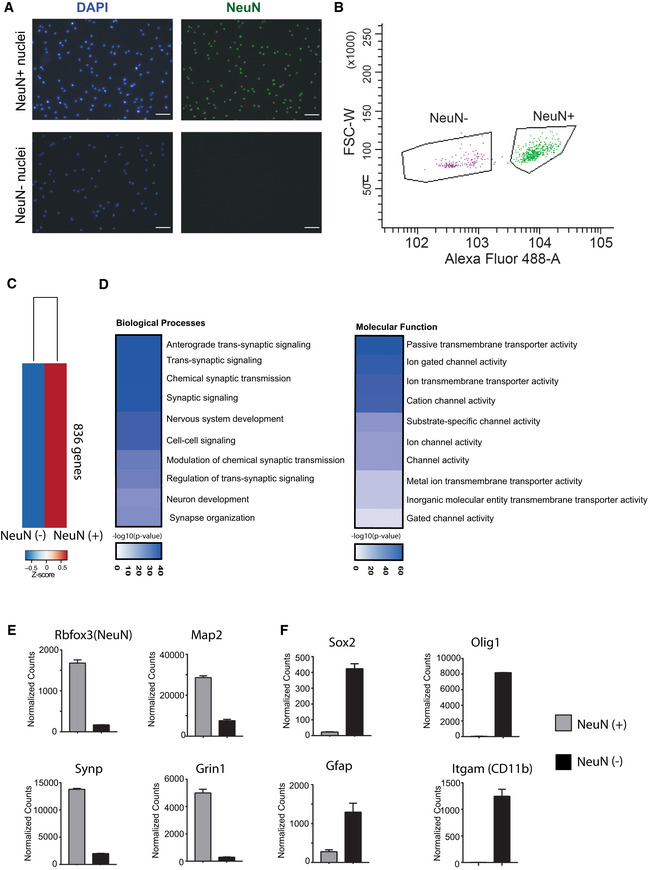
Figure EV4. Sorting neuronal and non‐neuronal nuclei for RNA‐Seq analysis.

- Representative images showing nuclei that were sorted using the neuronal marker NeuN. Note that no NeuN positive nuclei are detected in the NeuN (−) fraction confirming the purity of the approach. Scale bar: 50 μm.
- Gating strategy for NeuN (+) and NeuN (−) nuclei sorting.
- RNA‐sequencing (n = 2/group) was performed from NeuN (+) and NeuN (−) nuclei and a differential expression analysis was performed. Heat map shows 836 genes specifically enriched in NeuN (+) nuclei when compared to NeuN (−) nuclei. The criteria to select those genes were: adjusted P‐value < 0.01, base mean > 150, fold change > 5.
- GO‐term analysis showing that the top 10 enriched biological processes and molecular functions for the 836 genes enriched in NeuN (+) nuclei all represent specific neuronal processes.
- Normalized expression values obtained from the RNA‐seq experiment showing the expression of selected genes known to be enriched in neurons.
- Normalized expression values of genes that are known to be enriched in non‐neuronal cells including glia cells. Error bars indicate SEM.
Data information: Bar graphs indicate mean, Error bars indicate ± SEM. “n” indicates biological replicates.
