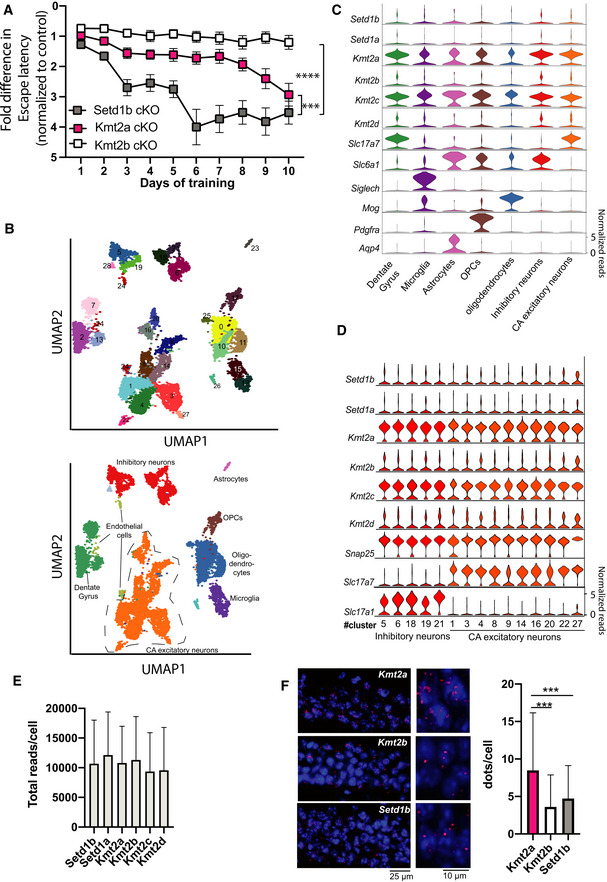
Figure 6. Comparative analysis of learning and single nucleus gene expression of Kmt2a, Kmt2b and Setd1b .

- Comparison of the escape latency in the 3 different KMT cKO mice during 10 days of training. Although we applied the same experimental setting, the experiments were performed at different time points ((Kerimoglu et al, 2013; Kerimoglu et al, 2017), and this study). Thus, for comparison we normalized the data to the corresponding control group. In this plot an increase in the fold change of the normalized escape latency depicts the difference to the corresponding control group. Hence, a higher fold change of the normalized escape latency indicates a greater difference to the corresponding control and thus more severe learning impairment. Setd1b cKO (n = 14) vs Kmt2a cKO (n = 13): Repeated measures ANOVA, genotype effect: F(1,25) = 16.83, ***P‐value < 0.001. Setd1b cKO (n = 14) vs Kmt2b cKO (n = 22): Repeated measures ANOVA, genotype effect: F(1,34) = 70.66, ****P‐value < 0.0001.
- UMAP plot showing the data from 15,661 nuclei. Upper panel shows the different clusters and their corresponding numbers. The lower panel shows the same UMAP plot colored for different groups of cells that are further analyzed in (C) and (D).
- Violin plots showing the expression of the 6 KMTs as well as marker genes for the different hippocampal cell types according the UMAP shown in lower panel B. Note that Kmt2a and Kmt2c are the highest expressed KMTs across cell types, while the other KMTs shown low to moderate expression.
- Violin plots showing the expression of the six KMTs and corresponding marker genes within the different clusters representing inhibitory and excitatory neurons. Note that there is no obvious difference of KMT expression between cell types. In agreement with the data shown in panel C, Kmt2a and Kmt2c exhibit the highest expression levels.
- Bar charts showing the total number of reads/cell that are positive for the corresponding KMT.
- Left panel shows representative images of RNAscope performed for Kmt2a, Kmt2b, and Setd1b. Right panel shows a bar chart quantifying the dots/cell (n = 1500 cells from 2 mice) indicative of the corresponding expression level. Kmt2a expression was significantly higher when compared with Kmt2b or Setd1b (***P‐value < 0.0001, Student's t‐test).
Data information: Bar graphs indicate mean, Error bars indicate ± SEM. “n” indicates biological replicates.
