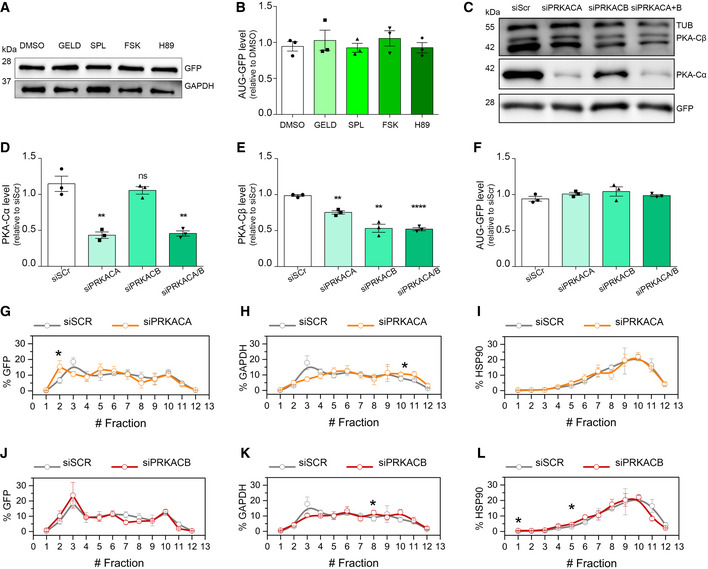
Figure EV2. Effect of the compounds and PKA‐knockdowns on AUG‐GFP levels.

-
A, BLysates from HEK293T cells, transfected with AUG‐GFP and treated for 24 h, immunoblotted using antibodies for GFP expression and GAPDH used as a loading control. (B) Quantification of (A) from three biological replicates. Data are mean ± SEM. No significant results using two‐tailed, unpaired t‐test.
-
C–FLysates from HEK293T cells, transfected with RNAi scrambled, PRKACA, PRKACB and PRKACA/B (72 h) and with AUG‐GFP (24 h), immunoblotted using antibodies for PKA‐Cα, PKA‐Cβ and GFP expression. GAPDH used as a loading control (C). (D) Quantification of PKA‐Cα expression from three biological replicates. Two‐tailed, unpaired t‐test, **P = 0.0334 siPRKACA versus siScr, **P = 0.0336 siPRKACA/B versus siScr. (E) Quantification of PKA‐Cβ expression from three biological replicates. Two‐tailed, unpaired t‐test, **P = 0.0010 siPRKACA versus siScr, **P = 0.0014 siPRKACB versus siScr, ****P < 0.0001 siPRKACA/B versus siScr. (F) Quantification of GFP expression from three biological replicates. No significant results using two‐tailed, unpaired t‐test. Data are mean ± SEM.
-
G–ICo‐sedimentation profile of GFP (G), GAPDH (H) and HSP90 (I) mRNAs along the sucrose gradient fractions of polysomal profiles from control (grey lines) and PRKACA‐depleted (orange lines) cells. Data are mean ± SEM from three independent biological replicates. One‐tailed t‐test, *P < 0.05.
-
J–LCo‐sedimentation profile of GFP (J), GAPDH (K) and HSP90 (L) mRNAs along the sucrose fractions of polysomal profiles from control (grey lines) and PRKACB‐depleted (red lines) cells. Data are mean ± SEM from three independent biological replicates. One‐tailed t‐test, *P < 0.05.
Source data are available online for this figure.
