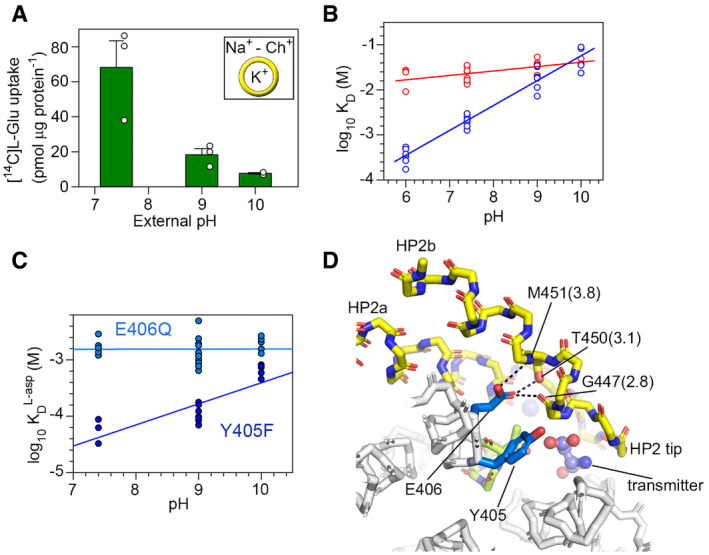
Figure 3. H+ and transmitter binding.

-
ANa+‐induced L‐glutamate uptake by purified EAAT1CRYST reconstituted in liposomes loaded with K+. Choline (Ch+) condition was subtracted to the Na+ condition.
-
BLog‐log plots of Na+ (red, n = 19) and L‐asp (blue, n = 27) KD, as a function of pH at [Na+] = 0.5 mM. Na+ (n = 10) and L‐asp (n = 7) titration data at pH 7.4 and 9.0, respectively, are also reported in Fig 1. Solid lines are fits of straight lines.
-
CLog‐log plots of L‐asp KD for EAAT1CRYST‐E406386Q (light blue, n = 24) and EAAT1CRYST‐Y405385F (dark blue, n = 18), as a function of pH at [Na+] = 0.5 mM.
-
DPotential H+‐bond network between protonated E406386 (TM7b) and residues in HP2b in EAAT1CRYST transmitter bound structure. HP2 is depicted in yellow and the 398NMDG motif in green. Residue numbering corresponds to EAAT1WT, and the interatomic distance (angstrom) is parenthesis.
Data information: In (A) bar plots depict averages and s.e.m. values of three independent experiments (empty circles) performed in triplicate. In (B and C) symbols represent individual KD values from n number of independent titrations.
