
Figure 4. Counter‐transported ion binding site.
-
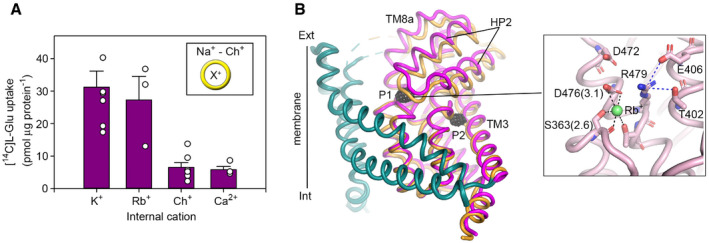
APurified EAAT1CRYST takes up L‐glutamate in liposomes loaded with K+ or Rb+, but not with choline (Ch+), or with Ch+ and Ca2+. Plots depict data as in Fig 3A.
-
BSuperimposition of Na+/transmitter and Rb+ bound EAAT1CRYST structures, respectively, with tranD depicted in orange (Na+/transmitter) and pink (Rb+). TM4 and UCPH101 are omitted for clarity. Black mesh depicts the anomalous‐difference map contoured at 3.5σ around the tranD. Rb+ coordination is shown in the inset. Residue numbering corresponds to EAAT1WT, and the coordination distance (angstrom) is parenthesis.
Data information: In (A) bar plots depict averages and s.e.m. values of three independent experiments (empty circles) performed in triplicate.