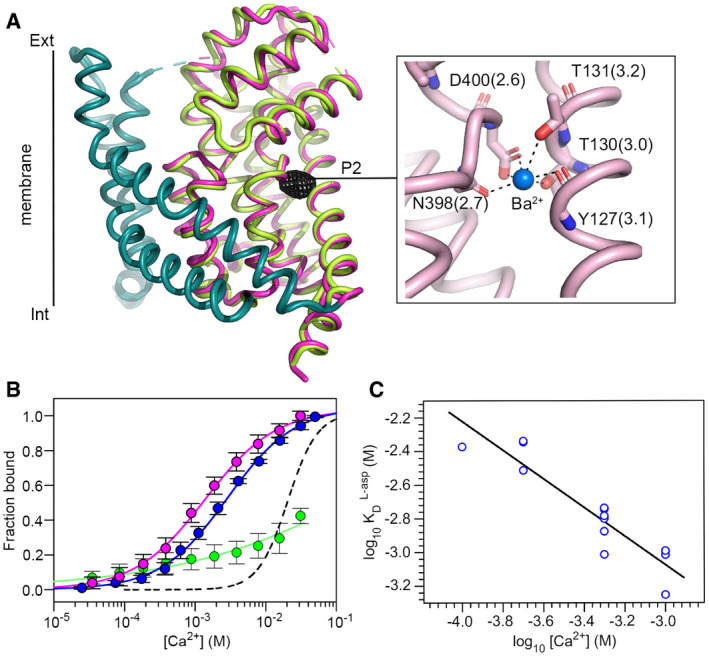
Figure 5. Divalent cation binding.

-
ASuperimposition of Rb+/Ba2+‐and Ba2+ bound EAAT1CRYST structures with tranD is depicted in pink and green, respectively, and TM4 removed for clarity. Black mesh depicts anomalous‐difference map in the absence of Rb+ contoured at 4σ around the tranD, and inset shows details of Ba2+ coordination at Na3. Residue numbering corresponds to EAAT1WT, and the coordination distance (angstrom) is parenthesis.
-
BCa2+ binding isotherms of EAAT1CRYST at pH = 7.4 in the presence (pink) and absence (blue) of UPCH101. Mutation D400380N at Na3 strongly impairs Ca2+ binding (green). Symbols represent average and s.e.m. values of at least three independent experiments. Solid lines represent fits of Hill equation and dashed line is the fit in Fig 1C (blue line) corresponding to Na+ binding.
-
CLog‐log plot of L‐asp KD as a function of Ca2+ (n = 13).
Data information: in (B) symbols represent average and s.e.m. values of at least three independent titrations. In (C), blue symbols represent individual KD values from n number of independent titrations.
