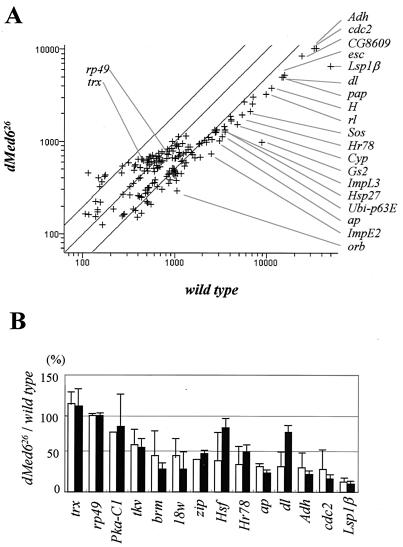
FIG. 7.
Expression profile of a dMed6 mutant. (A) Scatter plot analysis of microarray experiment. The hybridization intensities of the wild-type (x axis) and dMed6 mutant cDNA probes (y axis) are plotted on a log scale. rp49, trx, and genes down-regulated more than three-fold in the dMed6 mutant larvae are indicated. Diagonal lines, range of a twofold difference. Results from two independent hybridization experiments were averaged. (B) Comparison of expression levels of individual genes assayed by cDNA microarray (open bar) and quantitative RT-PCR (solid bar). Percentages of transcript in dMed6 mutant are compared to those for the wild type. Results from three independent quantitative RT-PCR experiments were averaged, and the deviations are marked with error bars.

