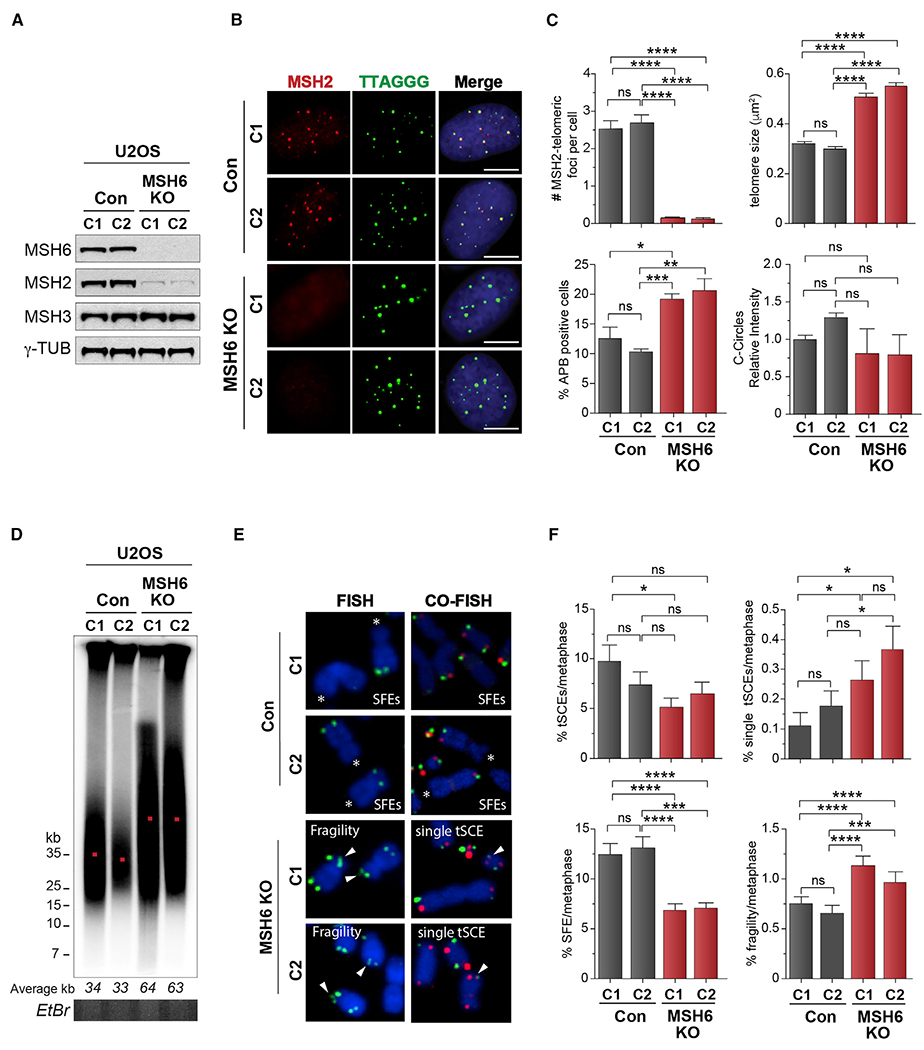
Figure 1. ALT telomere hyper-extension because of MutSα deficiency.

(A) Western blot showing MSH6 disruption in U2OS cells. γ-Tubulin is shown as a loading control.
(B) IF-FISH showing endogenous MSH2 co-localization with telomeres (TTAGGG-FISH) in control but not MSH6 knockout (KO) U2OS cells.
(C) Quantification of MSH2 foci and ALT phenotypes, including the percentage of ALT-associated PML bodies (APBs), telomere focus size, C-circles (CCs) in control, and MSH6 KO clones. For C-circles, levels are presented in relation to those detected in control clone C1.
(D) PFGE telomere length analysis of control (C1 and C2) and MSH6 KO clones (C1 and C2). Telomere size (kb) is shown below, and DNA loading is shown by ethidium bromide (EtBr) gel. Red dot indicates average telomere length
(E) Metaphase spreads prepared by FISH (TelC probe) and chromosome orientation FISH (CO-FISH) (TelC and TelG probes) from control and MSH6 KO clones showing signal free ends (SFEs), telomere fragility, and single inter-telomeric exchanges (single telomere sister chromatid exchanges [t-SCEs]).
(F) Quantifications of the percentage of double t-SCEs, single-telomere SCEs, telomere fragility, and signal-free ends (SFEs) in control and MSH6 KO clones.
All data represent means ± SEM, n = 3 biological replicates. *p < 0.05, **p < 0.01, ***p < 0.001, ****p < 0.0001 (one-way ANOVA). Unless otherwise indicated, all FISH experiments were conducted using TelC FISH probe. All scale bars, 5 μm. See also Figure S1.
