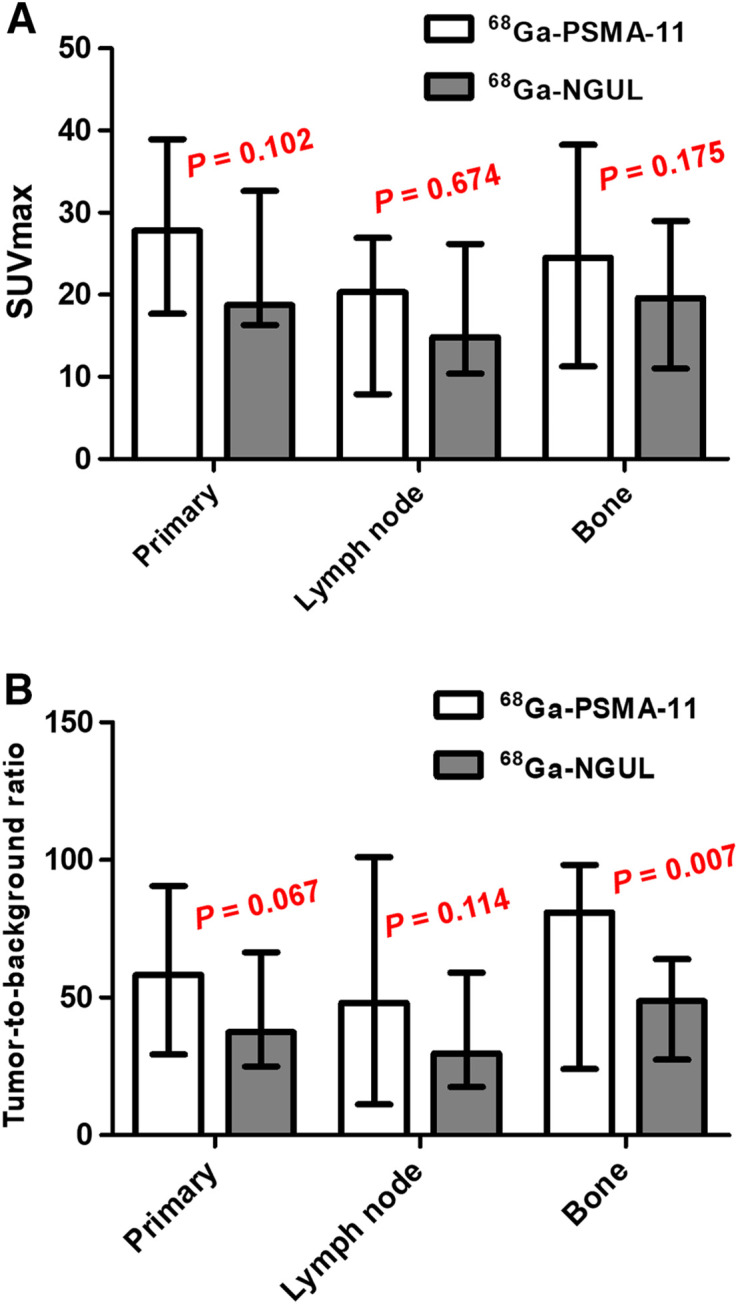
FIGURE 3.

(A) SUVmax of primary tumor, lymph node, and bone metastases for 68Ga-PSMA-11 and 68Ga-NGUL. (B) Tumor-to-background ratio of primary tumor, lymph node, and bone metastases for 68Ga-PSMA-11 and 68Ga-NGUL. Median with interquartile range as error bar is plotted on bar chart. Wilcoxon signed-rank test for paired data was used for statistical comparison.
